#MakeoverMonday 2020 Week 38: Books in Germany
We haven't used time series data in MM for a while, so I was pleased to find a dataset that combined several years of data at the month level with a topic I love: books and reading. The original visualization comes from Eurostat
What works well:
- The title is ok
- The colors are distinct from one another
- The timescale is easy to understand
What could be improved:
- There is no contextual information in the image, e.g. what are 'all products'?
- The colors are pretty heavy and the image plus background make this viz very colourful and not in a good way
- It would be helpful to have the index explained a bit further
What I did:
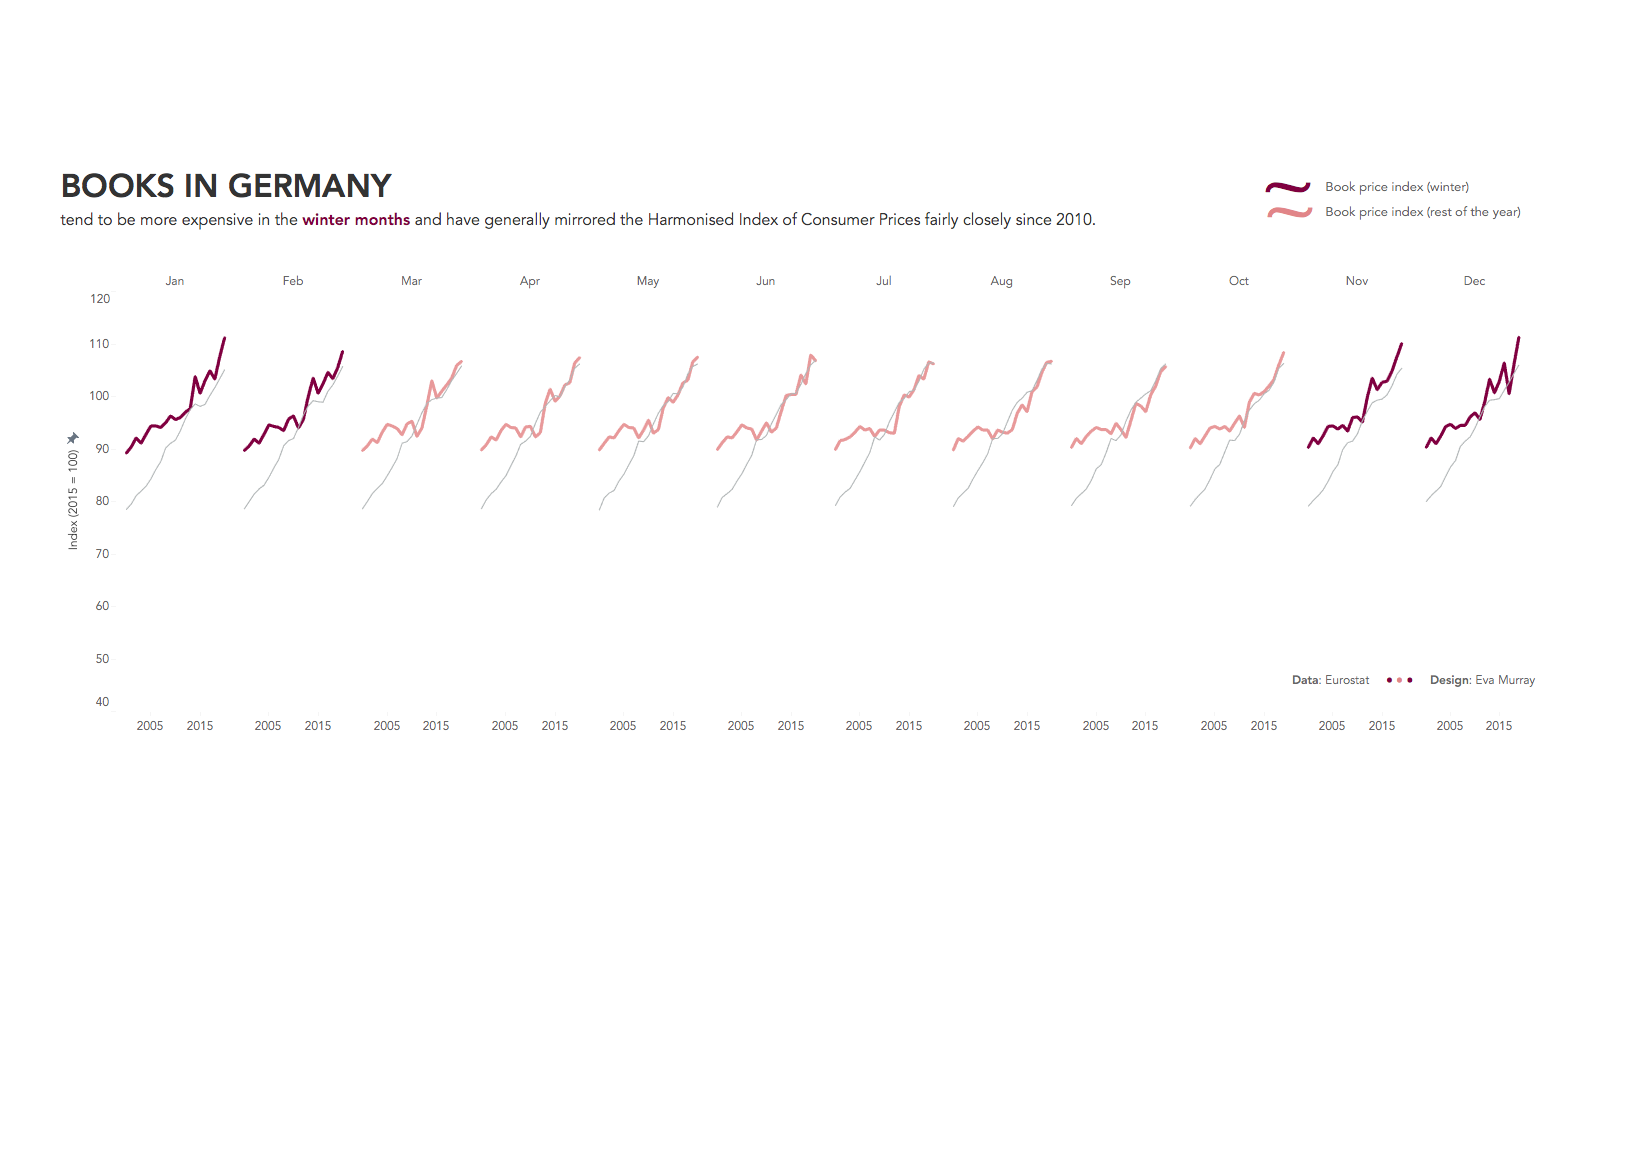
- I've been missing line charts so I opted for a quick and simple line chart, showing the seasonality of book prices (somewhat...) and that they've been in line with general consumer prices for the last decade
- Here is my viz, click on the image for the interactive version:
