Makeover Monday week 40, 2018: Avocado consumption
Avocadoes are quite easily the tastiest fatty fruit I know. They're amazingly delicious and finding a perfectly ripe avocado always feels like a major accomplishment.
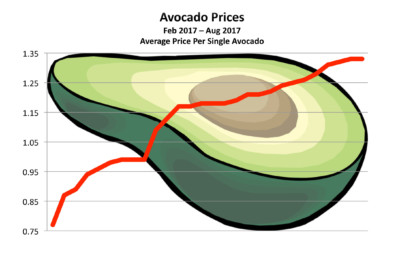
This week Andy gifted me a dataset about avocado prices, and it's a nice and simple one. Here is the original viz:
What works well:
- The title is simple, the subtitle is explanatory making it very clear what this viz is about
- The avocado is eyecatching and makes it pretty obvious what the data is about even before I read the title
- The gridlines help to track the price line over time
What could be improved:
- What currency are these prices in?
- What is the timeline? It says Feb-Aug 2017 but where are the different months? The x-axis should be labeled
- The image is very distracting
- A green image behind a red line makes it very difficult, if not impossible, for people with color blindness to see the data points, i.e. the line
- Where are these prices? Are they across the country and if so, which country? Are they for a region, a city, etc.?
What I did:
- I slept on it. I started my analysis on Sunday afternoon but didn't get anywhere at first. Then I found out that the data.world web data connector had returned only two years worth of data, so I decided to tackle it with fresh eyes in the morning (and with the downloaded csv file)
- I had started with an analysis of consumption over time and once I used all the data I noticed significant spikes every early February.
- A quick google search of why does avocado consumption spike in february? helped me find this article which confirmed that the spikes were linked to a specific recurring event. The Super Bowl. So I googled the past game dates and it all lined up so very nicely.
- I have to say I am feeling rather pleased with myself, especially because I could never tell you when Super Bowl is or what people eat during it.
- So with that, here is my viz for this week:
Click to view on Tableau public
