Makeover Monday week 26, 2018: London Cycle Hire Usage

We have reached the half-way point of the year. 26 weeks of Makeover Monday (almost) behind us, 26 weeks of Makeover Monday to go.For this week we're playing with a large dataset again, looking at the hire usage of London's Boris Bikes. The original viz comes from Sophie Sparkes and shows us the usage trends by time of day, day of the week and month of the year.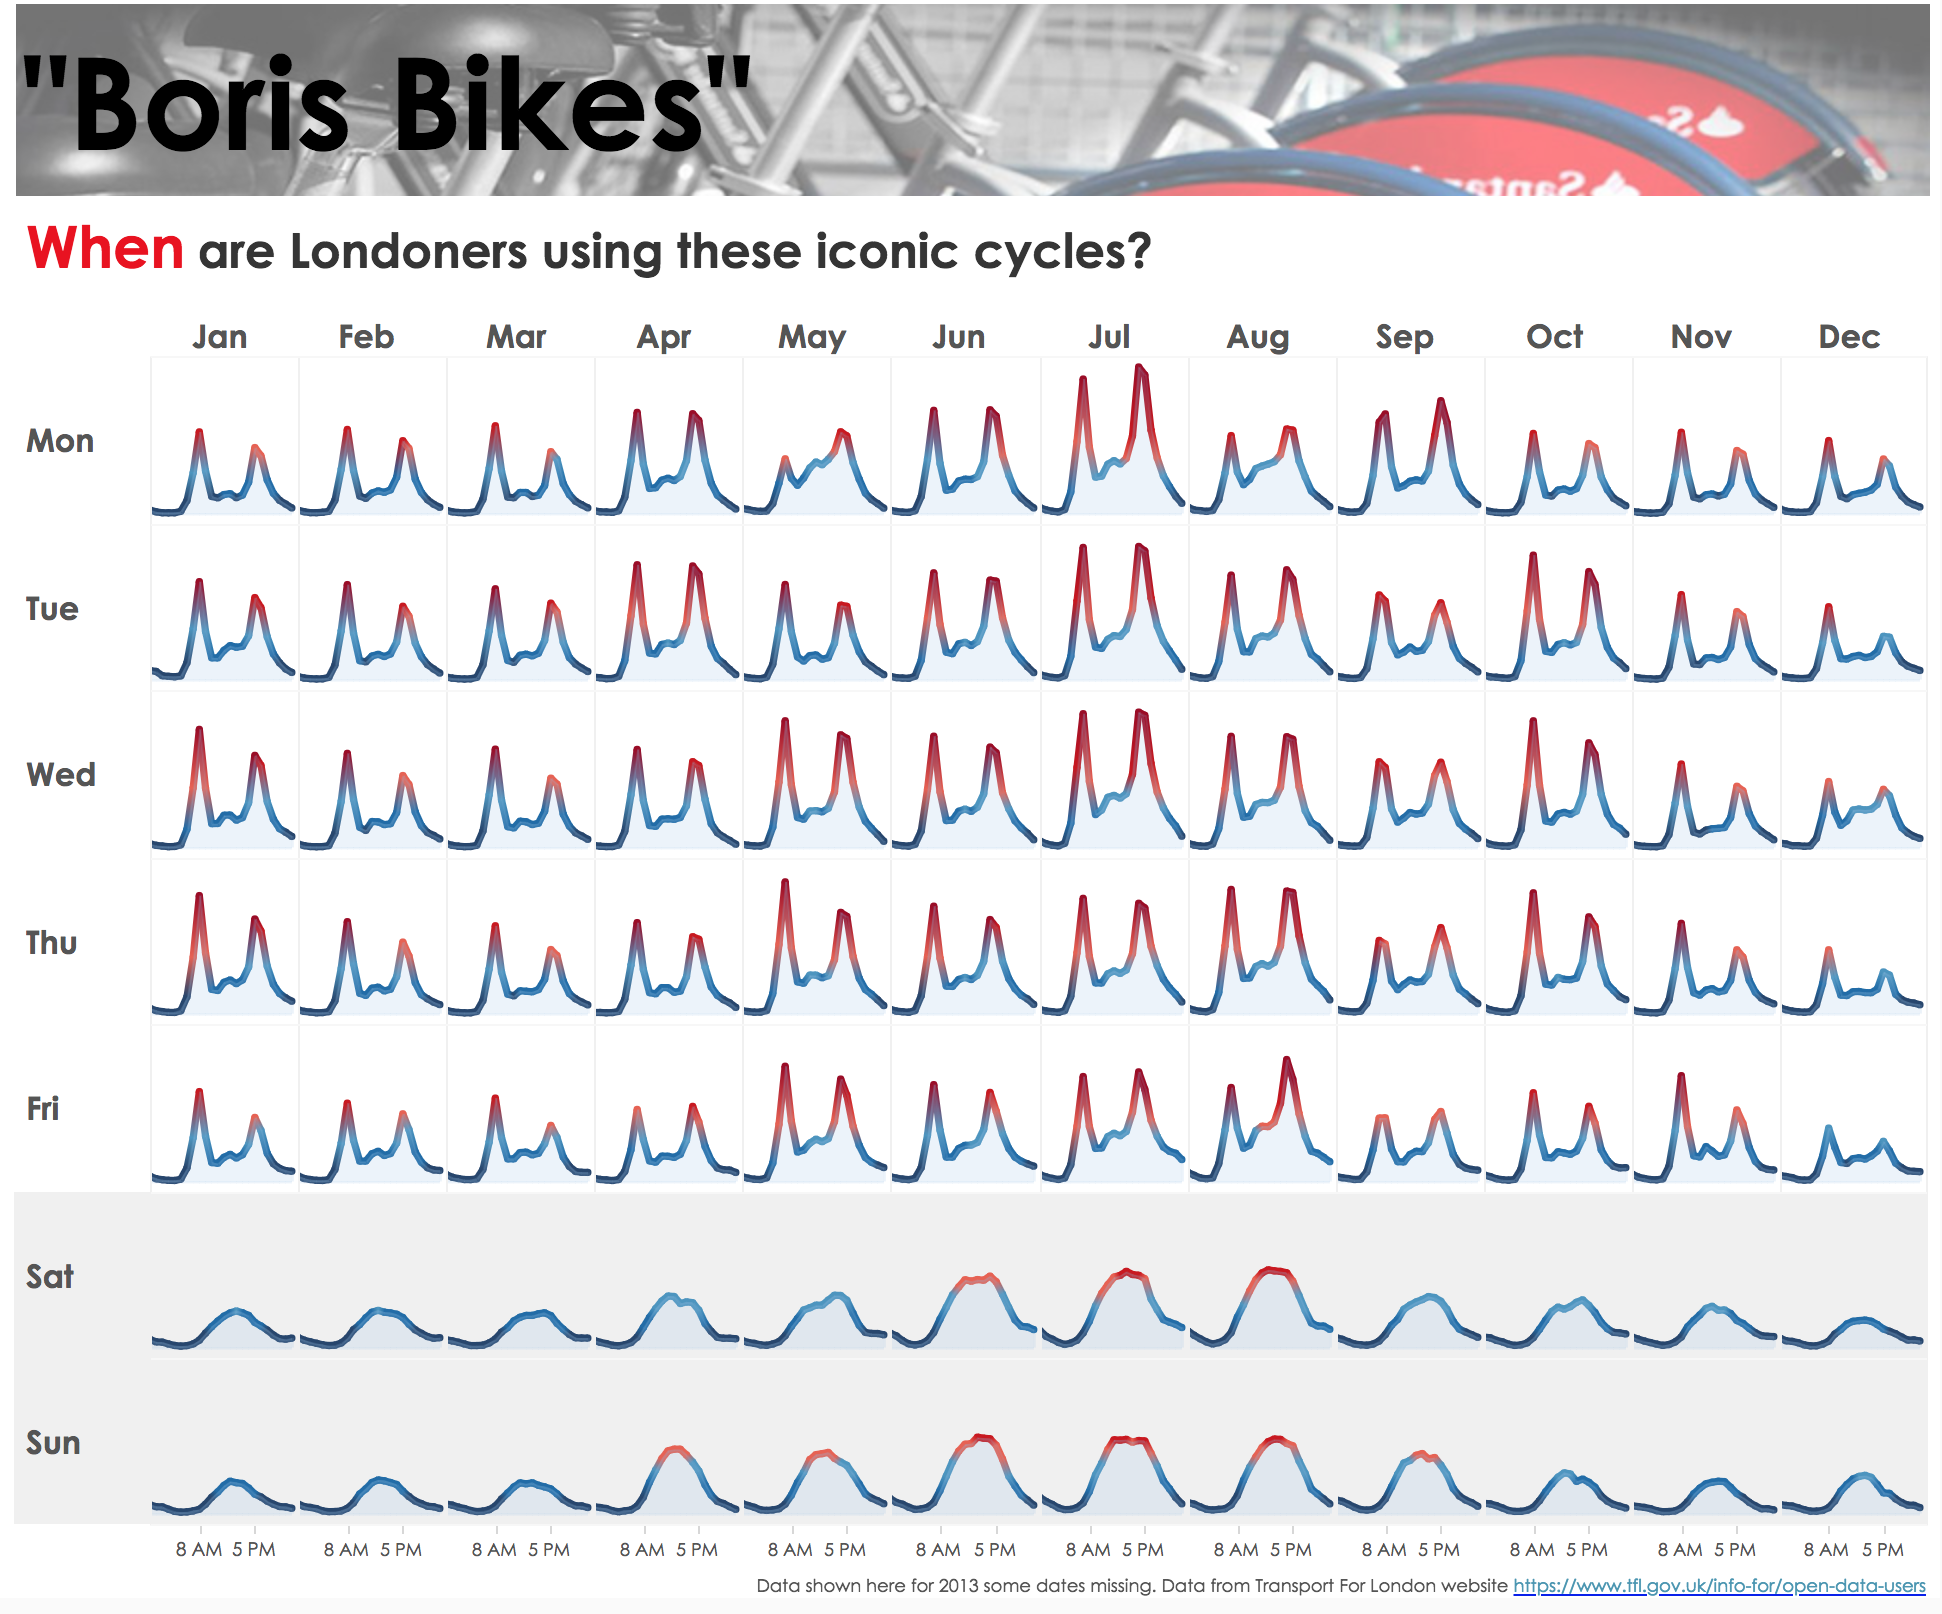
What works well:
- I really like the design of this viz. Line charts are a great way to show these usage patterns and also reflect the design of an elevation chart, commonly used by cyclists to visualize their data
- Great color choices that align to the Santander Bike design in the title image
- It's a very simple visualization that is easy to understand.
- The subtitle contains a question that can be answered by looking at the data
- The shading of the weekend days is very effective to highlight the difference in the pattern
What could be improved:
- I'd love to know what Sophie's insights were from this data. Does she have suggestions for why Thursdays are such popular days even in January and February?
- I'd also like to understand what the y-axis is. I can assume it's the number of rides, but it could also be the number of bikes used or the kilometres travelled.
What I did:
- I was interested in the patterns I found for early morning and late afternoon bike hire, so tried to point these out in my viz
- I felt this data was perfect for a heatmap and some spark lines, so I added those
- and my new favorite: stepped lines :-)
- Add to it a custom font that makes me think of 1920's cycling posters and I was done...
- Click on the image for the interactive version
