by Eva Murray | Jun 11, 2020 | Makeover Monday, Tableau
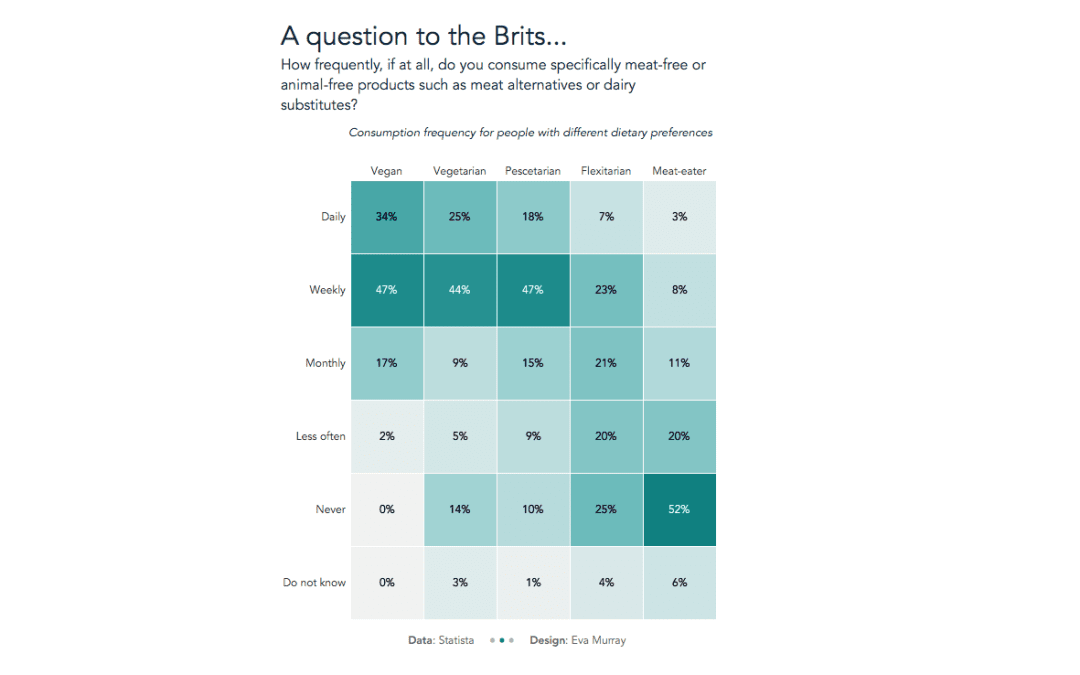
This week Charlie chose a viz about the eating habits of people in the UK. Plant-based foods and a plant-based diet have become more popular, with an increasing number of people also choosing to go vegan. The below visualization is from Statista who asked people how...
by Eva Murray | Jun 1, 2020 | Makeover Monday, Tableau
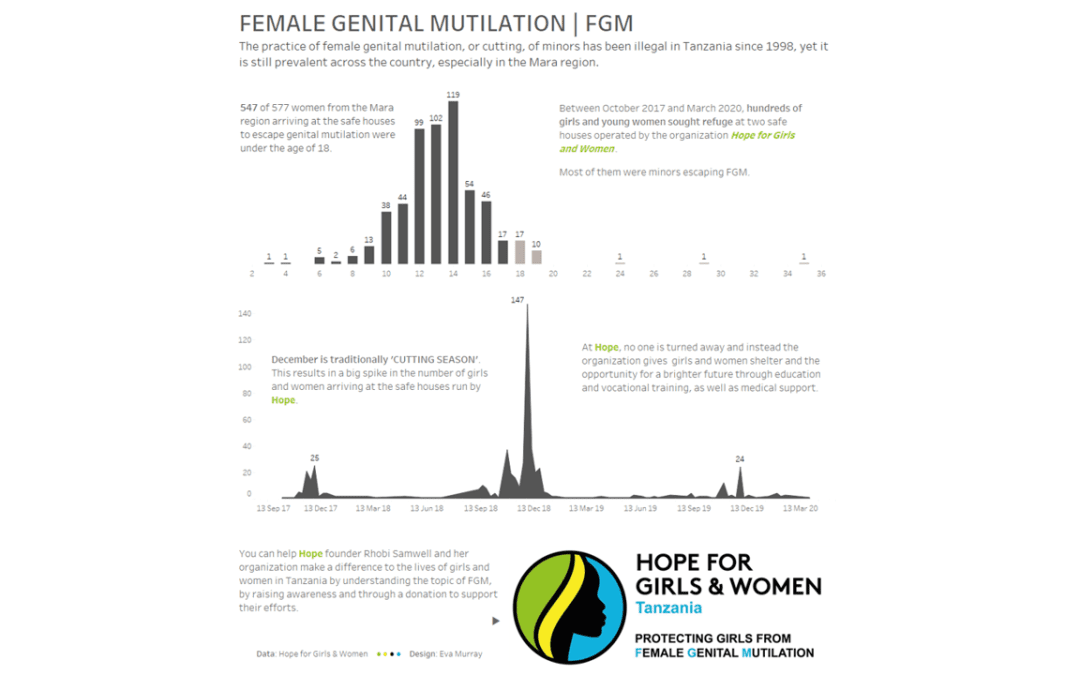
Our collaboration with Operation Fistula for #Viz5 is here with another dataset. This time the topic is pretty horrific, which makes it all the more important to talk about and tackle. We’re looking at FGM, female genital mutilation, and more specifically the...
by Eva Murray | May 29, 2020 | Makeover Monday, Tableau
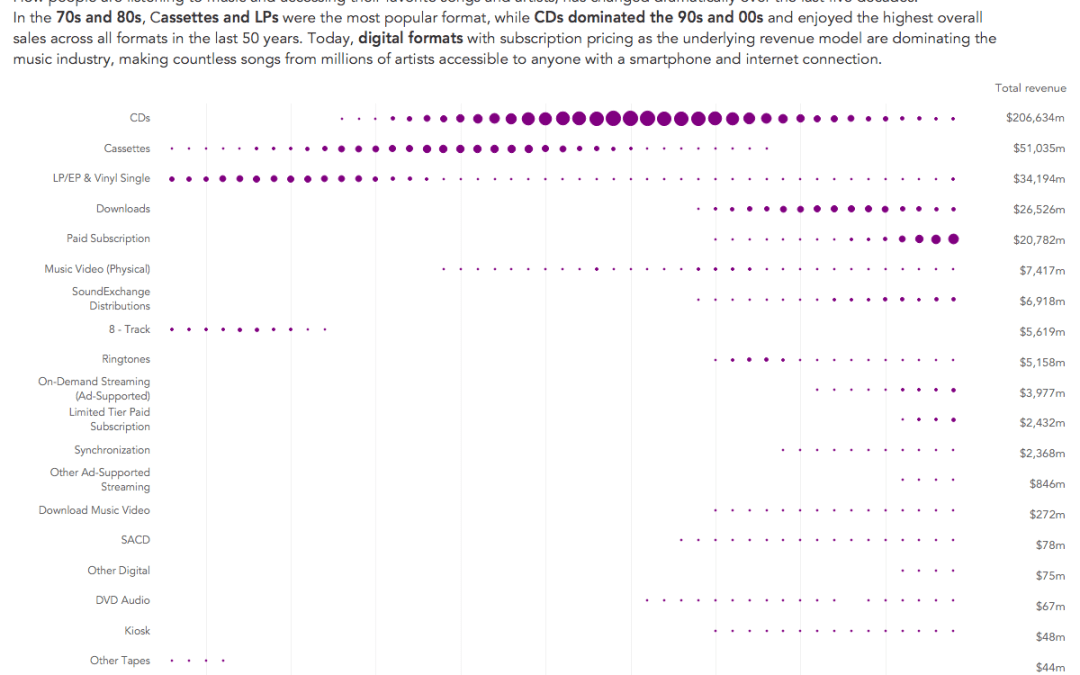
For this week’s #MakeoverMonday, Charlie picked a dataset about music industry sales in the US. I’ll admit I’m one of those people who are fairly indifferent when it comes to music. There is stuff I like and stuff I don’t like and most of my...
by Eva Murray | May 18, 2020 | Makeover Monday, Tableau
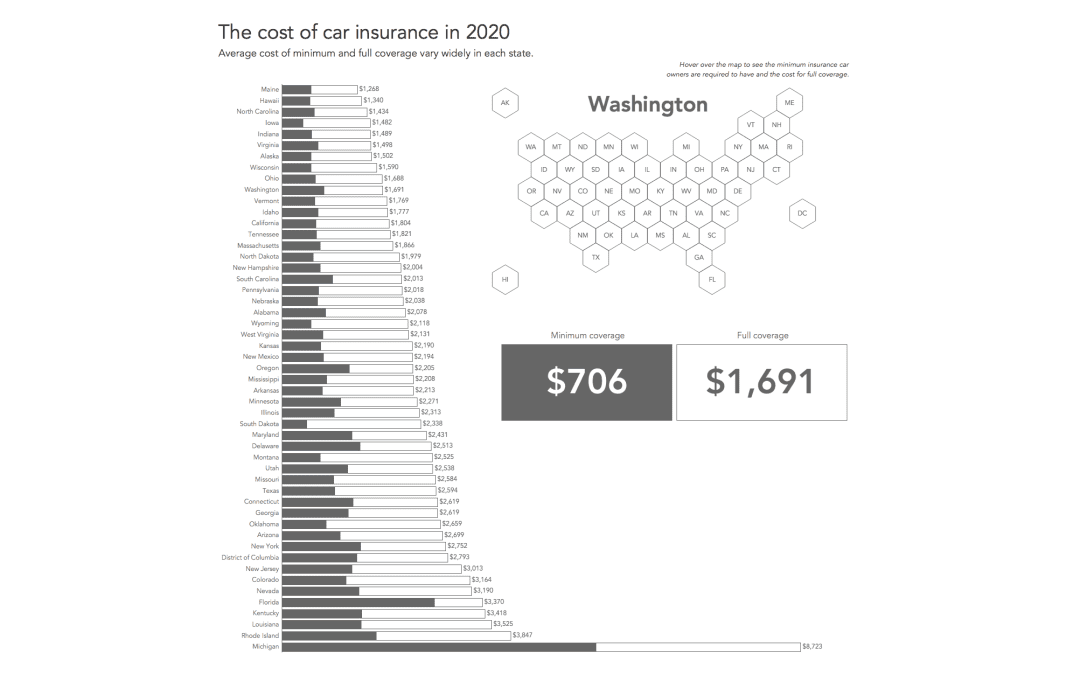
For this week’s MakeoverMonday challenge we are looking at car insurance rates – the minimum and the maximum – for each US state. There are significant differences between the states and the visualization I found that aims to show these differences...
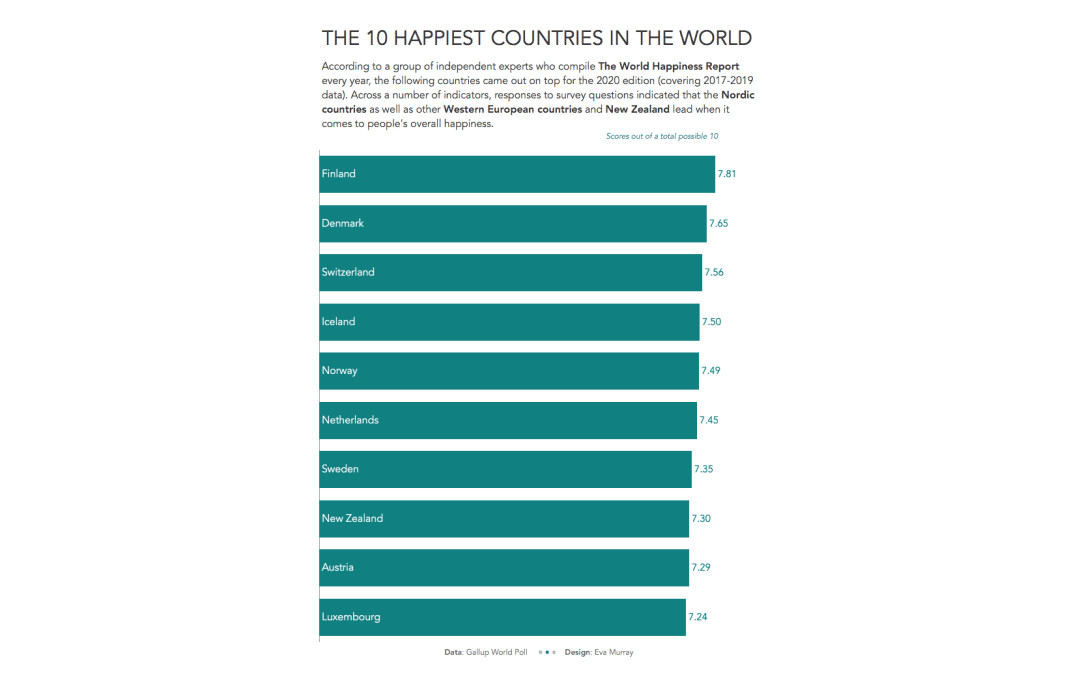
by Eva Murray | May 13, 2020 | Makeover Monday, Tableau
This week we’re looking at the World Happiness Report 2020, which lists over 150 countries in order of their reported happiness, based on a survey conducted by Gallup. This is the viz:...
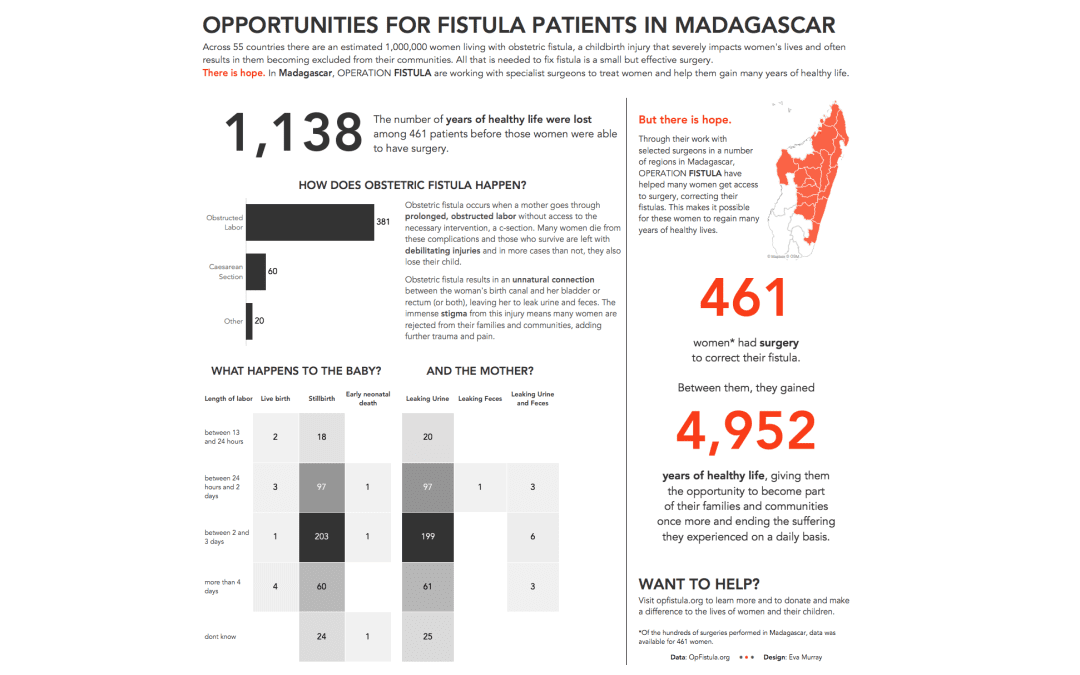
by Eva Murray | May 6, 2020 | Makeover Monday, Tableau
For week 18 we are tackling another #Viz5 subject, this time the topic of obstetric fistula, which is the focus of our #MakeoverMonday collaboration partner Operation Fistula. May is a month focused on Fistula Awareness with 23rd May being the International Day to End...