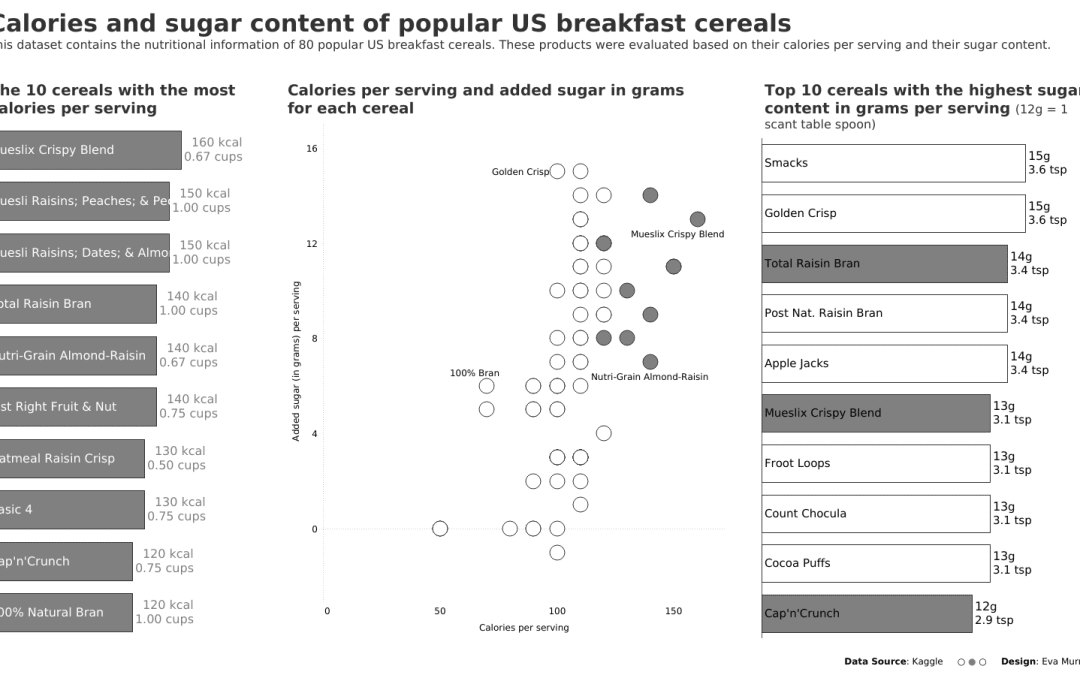
by Eva Murray | Sep 9, 2020 | Tableau
Last week I asked the community to submit datasets if they had any interesting ones in mind, especially if they came with a visualization to makeover. Michelle Frayman answered my call and sent me the dataset we’re using this week. Her two sons, Max and Sam,...
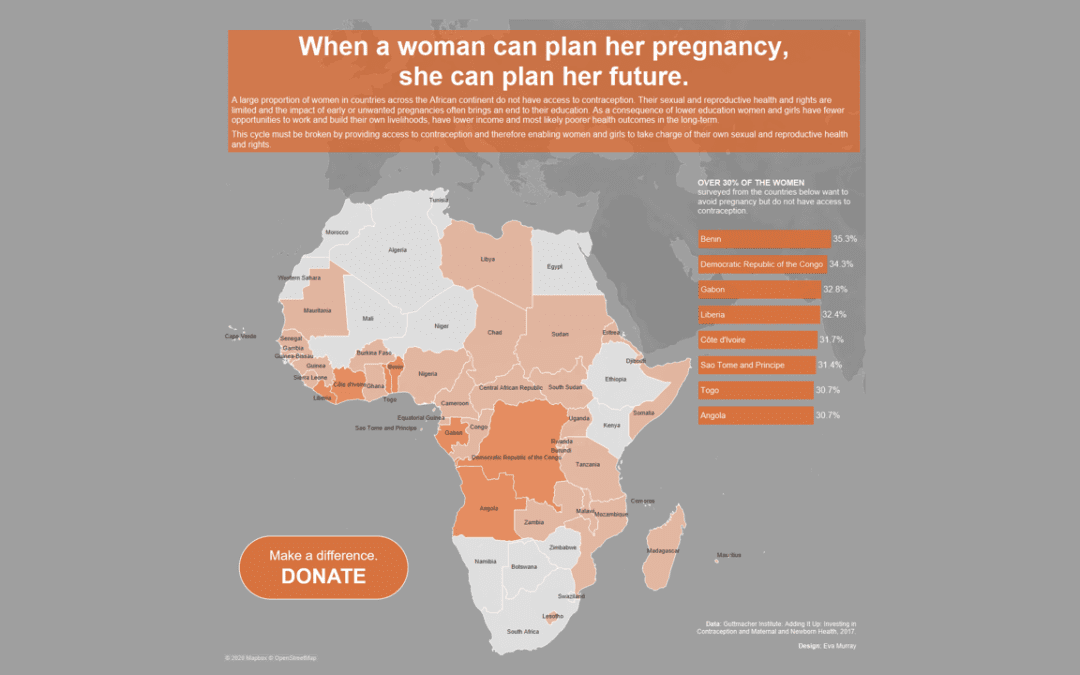
by Eva Murray | Aug 26, 2020 | Tableau
For week 34 of #MakeoverMonday, we are once again partnering with the team at Operation Fistula for a #Viz5 challenge, visualizing data about the issues impacting women and girls. This time, we’re looking at Sexual and Reproductive Health and Rights. The...
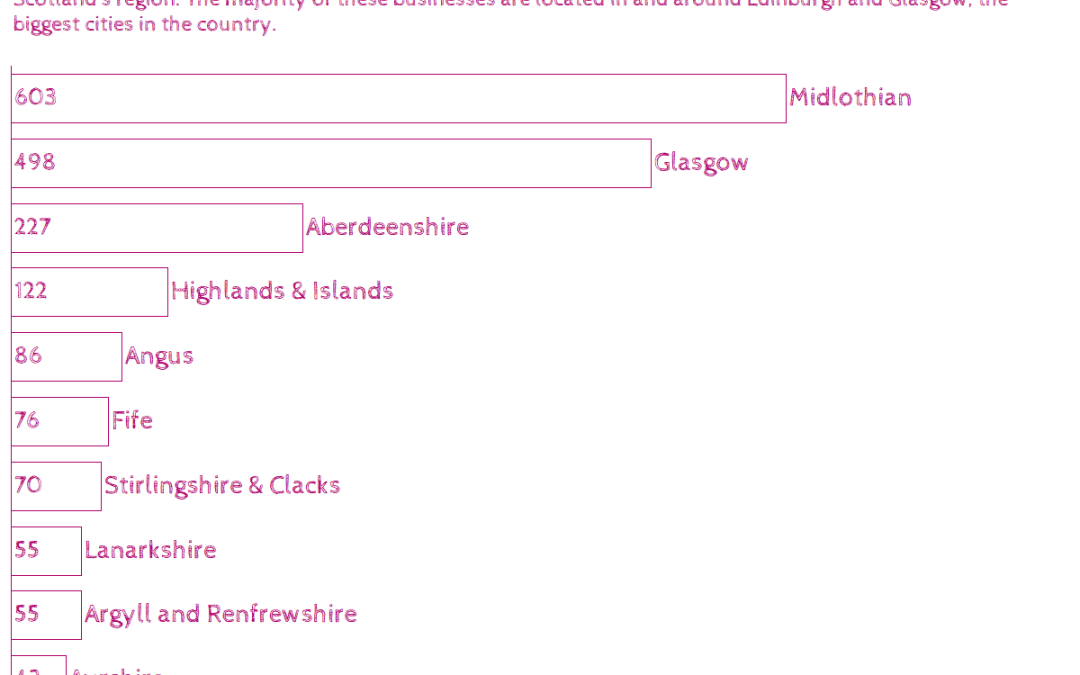
by Eva Murray | Aug 21, 2020 | Tableau
For week 33, Charlie chose a dataset about Scotland, featuring a map. Here is the original viz: https://companyconnecting.com/sites/default/files/Company-Connecting-Pg-1%20%281%29.jpg What works well: The map grabs my attention The word Scotland in the title is nice...
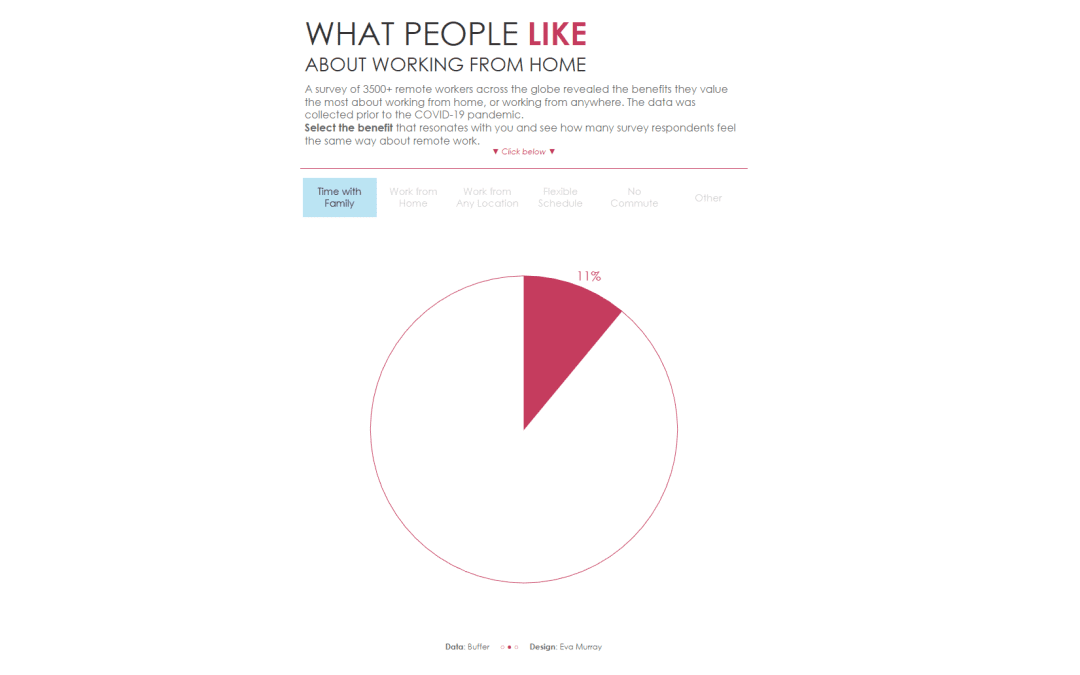
by Eva Murray | Aug 13, 2020 | Tableau
This has to be a quick post, so here we go: The original viz: https://media.data.world/krL9eIWTdQt3DtZqqTwS_benefits-of-remote-working.png What works well: It looks engaging. The topic is simple, so the title is sufficient and the labels on the stacked bar chart help...
by Eva Murray | Aug 6, 2020 | Tableau
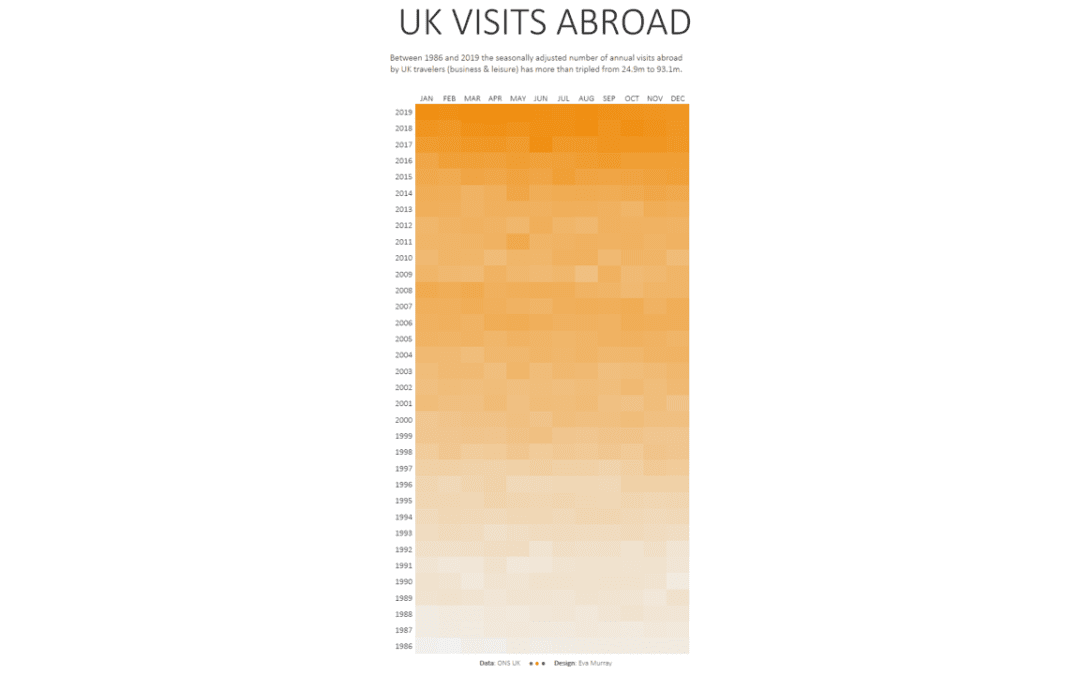
For this week’s #MakeoverMonday we’re looking at how many visits abroad people from the UK are making on a monthly basis. This is the original chart from the Office for National Statistics (ONS): What works well: A line chart is a good choice for this type...
by Eva Murray | Jul 28, 2020 | Tableau
This week sees us tackle another #Viz5 dataset, focusing on a gender equality topic: women in power, i.e. the parliamentary representation of women. The dataset comes from the World Bank and the team at Operation Fistula created a visualization for us to use as a...