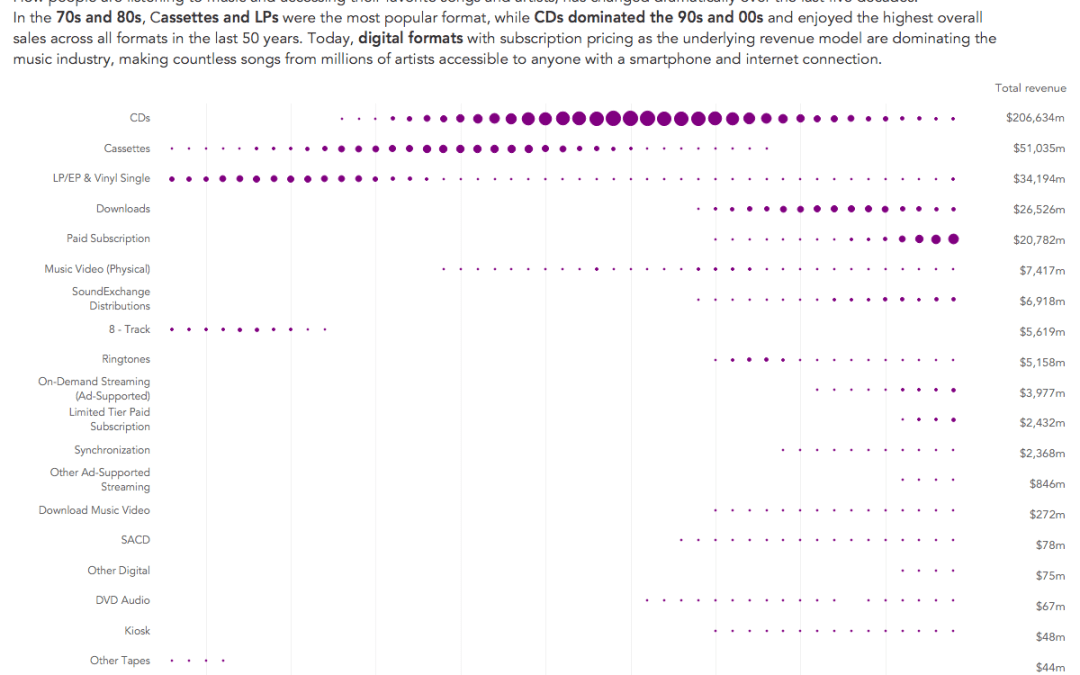
by Eva Murray | May 29, 2020 | Makeover Monday, Tableau
For this week’s #MakeoverMonday, Charlie picked a dataset about music industry sales in the US. I’ll admit I’m one of those people who are fairly indifferent when it comes to music. There is stuff I like and stuff I don’t like and most of my...
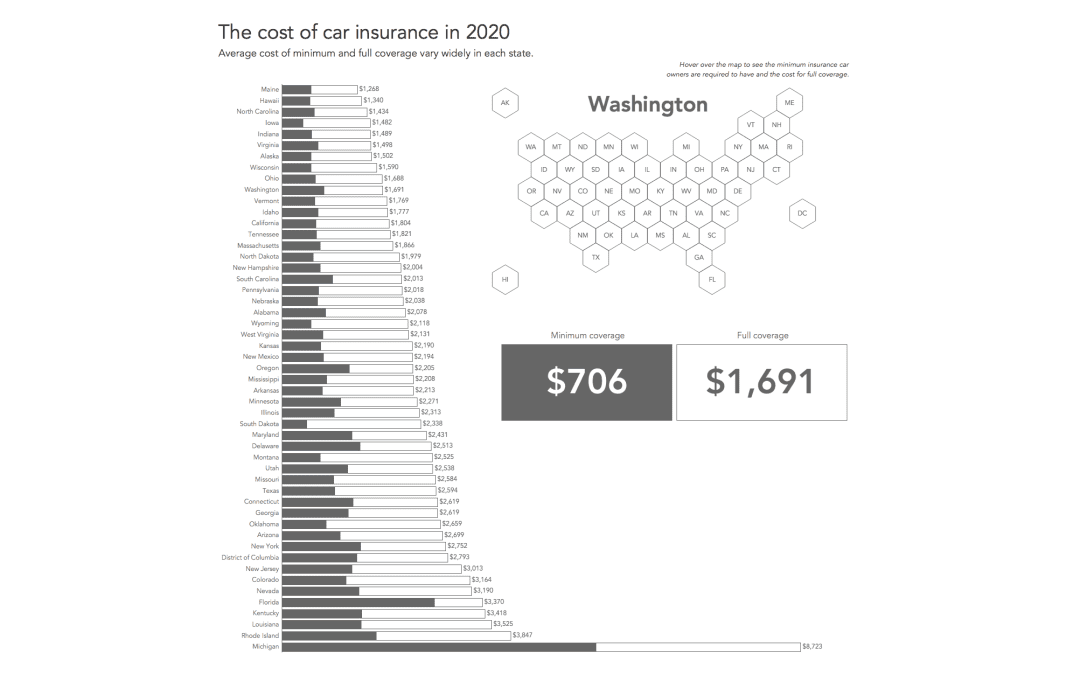
by Eva Murray | May 18, 2020 | Makeover Monday, Tableau
For this week’s MakeoverMonday challenge we are looking at car insurance rates – the minimum and the maximum – for each US state. There are significant differences between the states and the visualization I found that aims to show these differences...
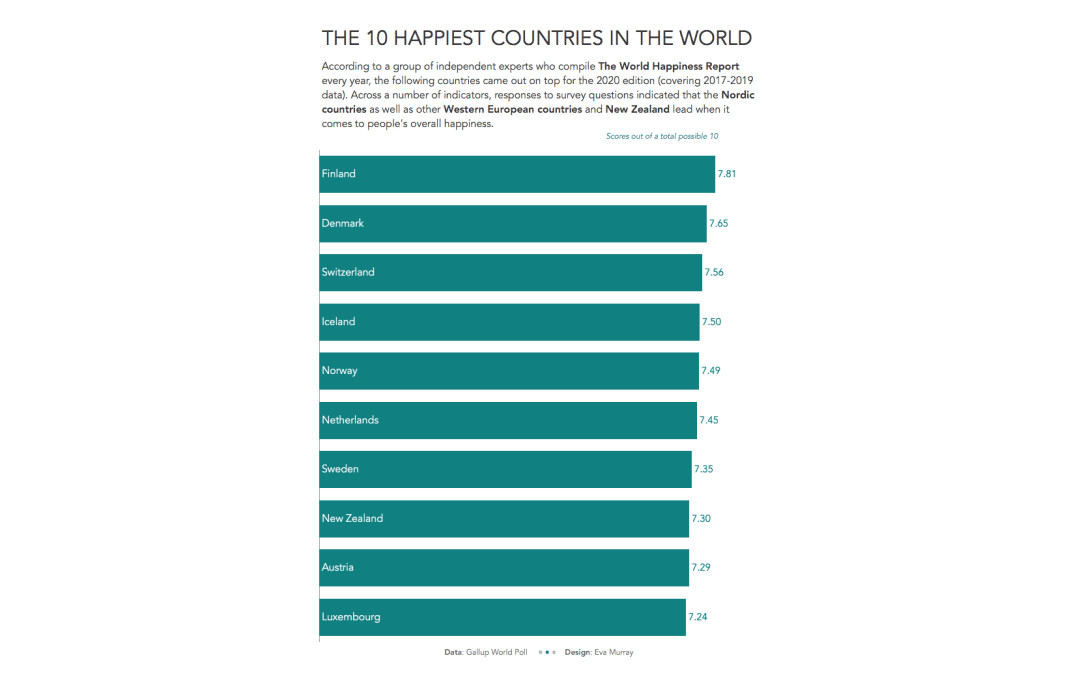
by Eva Murray | May 13, 2020 | Makeover Monday, Tableau
This week we’re looking at the World Happiness Report 2020, which lists over 150 countries in order of their reported happiness, based on a survey conducted by Gallup. This is the viz:...
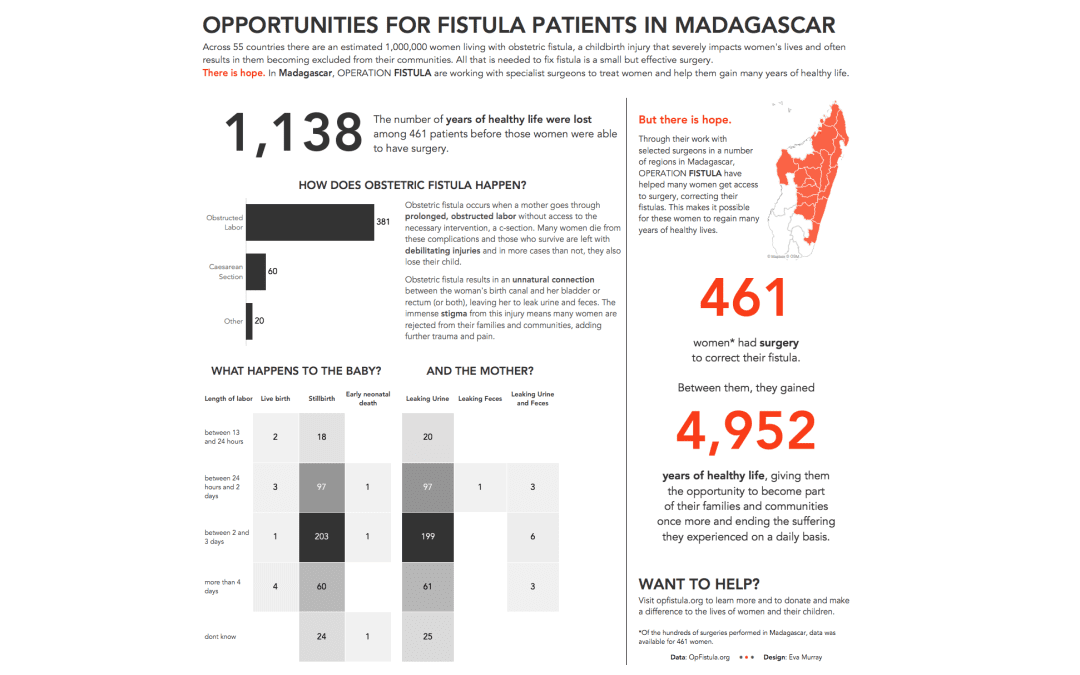
by Eva Murray | May 6, 2020 | Makeover Monday, Tableau
For week 18 we are tackling another #Viz5 subject, this time the topic of obstetric fistula, which is the focus of our #MakeoverMonday collaboration partner Operation Fistula. May is a month focused on Fistula Awareness with 23rd May being the International Day to End...
by Eva Murray | Apr 26, 2020 | Makeover Monday, Tableau
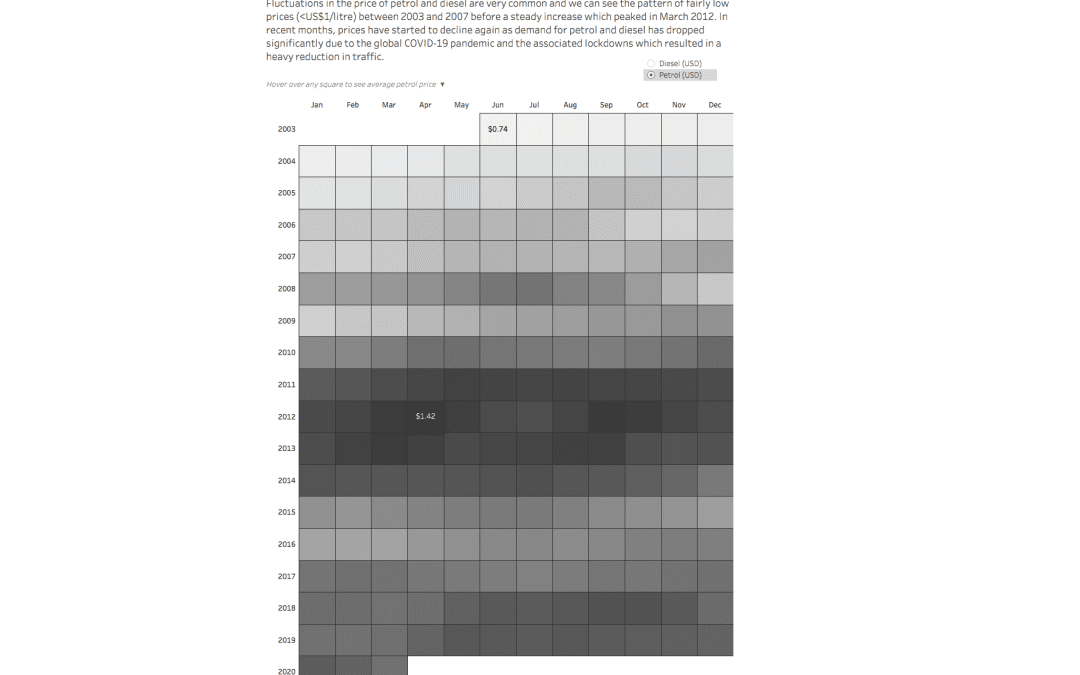
For week 17 we’re looking at UK petrol and diesel prices at a weekly level. Petrol prices at home in Germany are a topic of constant discussion and some people will go to great lengths to save a few cents here and there. Let’s have a look at the original:...
by Eva Murray | Apr 13, 2020 | Makeover Monday, Tableau
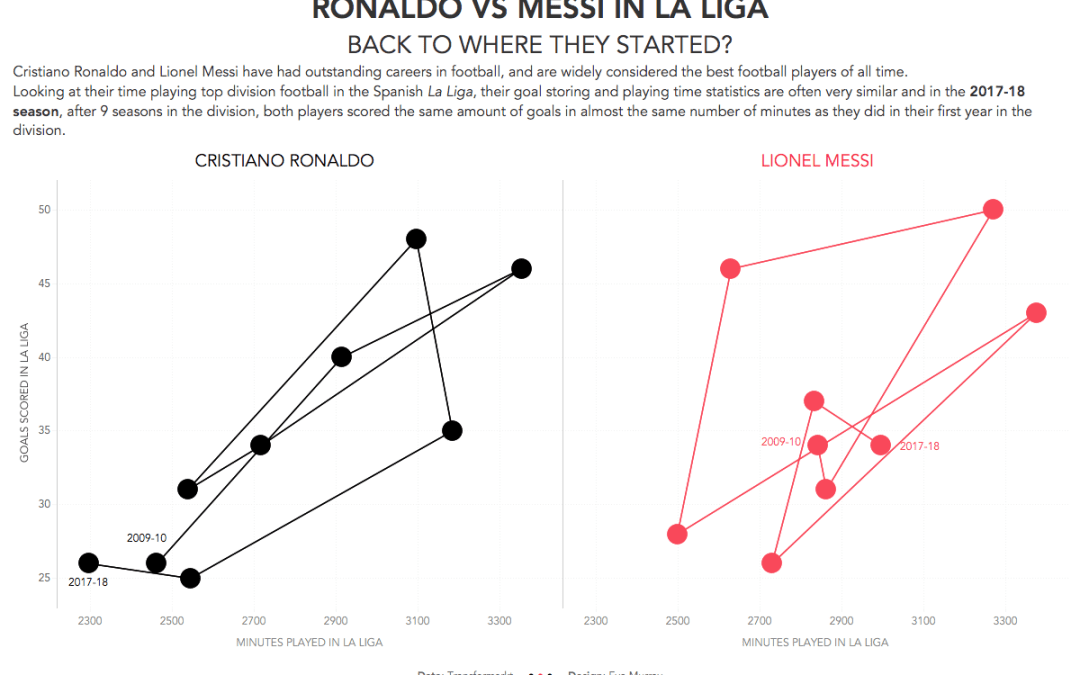
This week it’s a lighter topic. Football. I like it! Charlie chose a Viz from Soccerment, comparing goals per match in La Liga by Messi vs Ronaldo. Here is the original:...