by Eva Murray | Jul 29, 2019 | Makeover Monday, Tableau
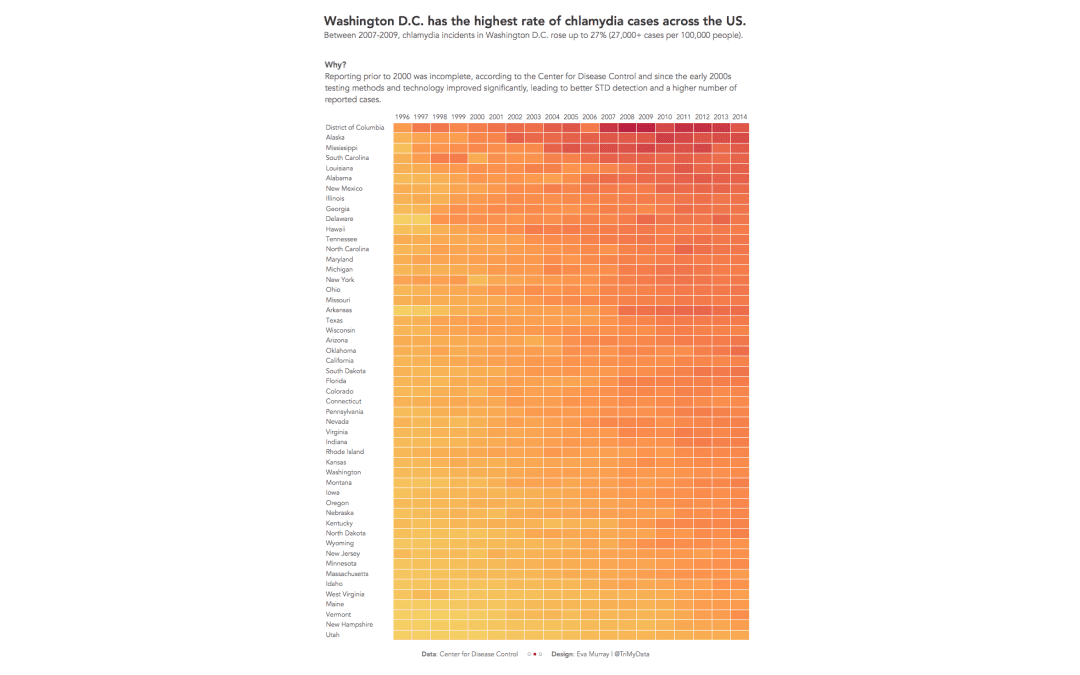
This week’s #MakeoverMonday takes us to one of Andy’s very first vizzes and one of the first vizzes published on Tableau Public (he published 8 vizzes the day the platform went live). We’re looking at STD infection rates in America and the original...
by Eva Murray | Jul 22, 2019 | Makeover Monday, Tableau
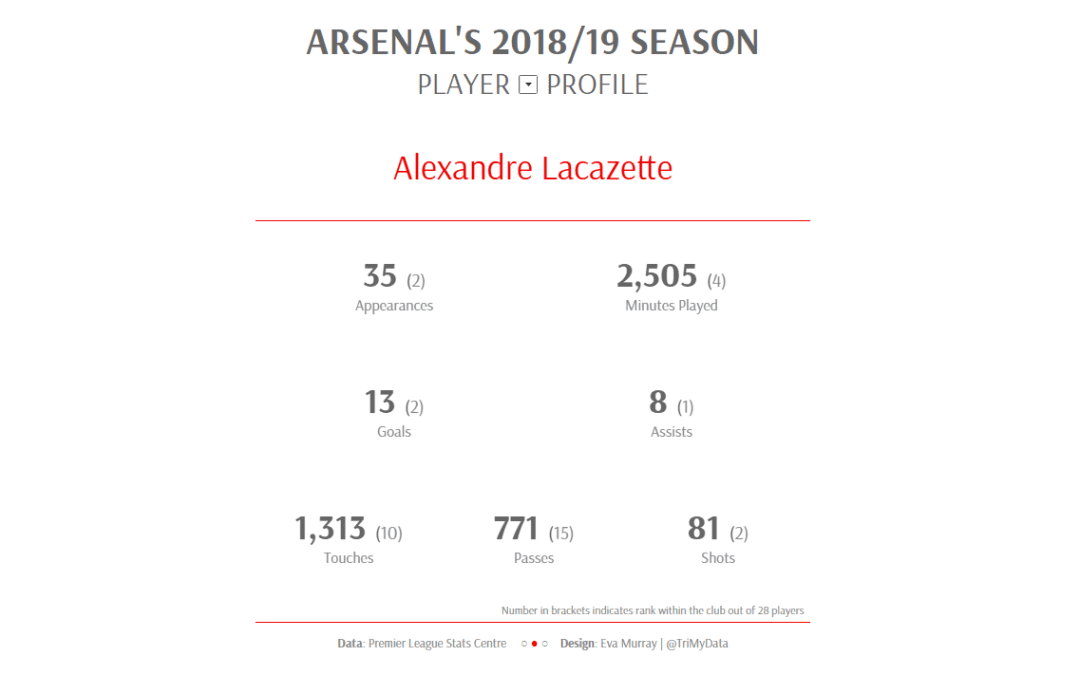
This week’s #MakeoverMonday will be Andy’s 800th Tableau Public viz, so I decided to surprise him by picking a dataset about Arsenal, his favorite club. While I couldn’t find an actual viz to go with it and had to simply choose a table I found...
by Eva Murray | Jul 15, 2019 | Makeover Monday, Tableau
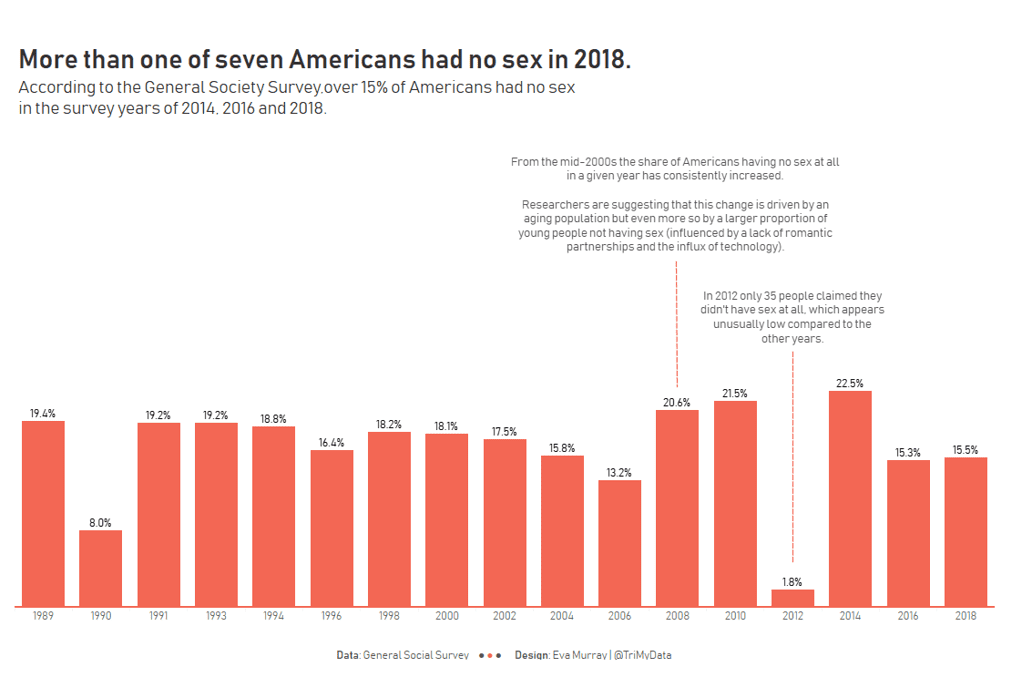
For week 29, Andy picked a topic that is likely to cause a few people to blush. It’s always interesting to observe what people’s comments are or how reluctant they become to participate when topics are a bit more controversial or – heaven forbid...
by Eva Murray | Jul 8, 2019 | Makeover Monday, Tableau
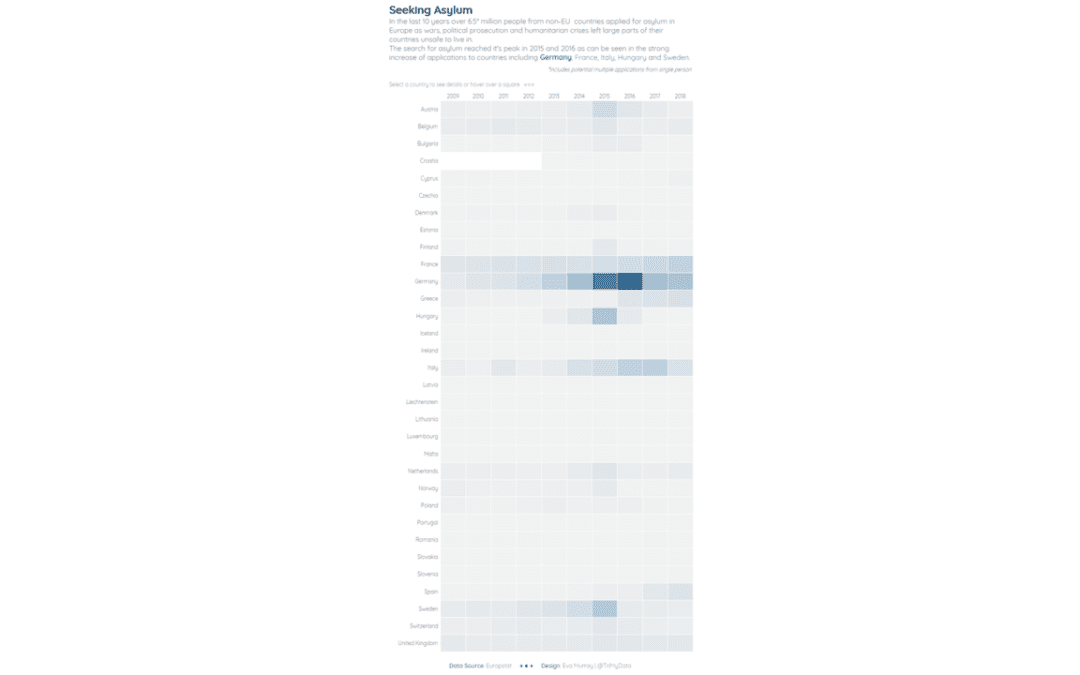
This week we’re looking at asylum applications from outside the EU by people seeking protection in EU countries. The original viz was published by the European Asylum Support Office based on Eurostat data and looks like this: What works well: The map is...
by Eva Murray | Jul 1, 2019 | Makeover Monday, Tableau
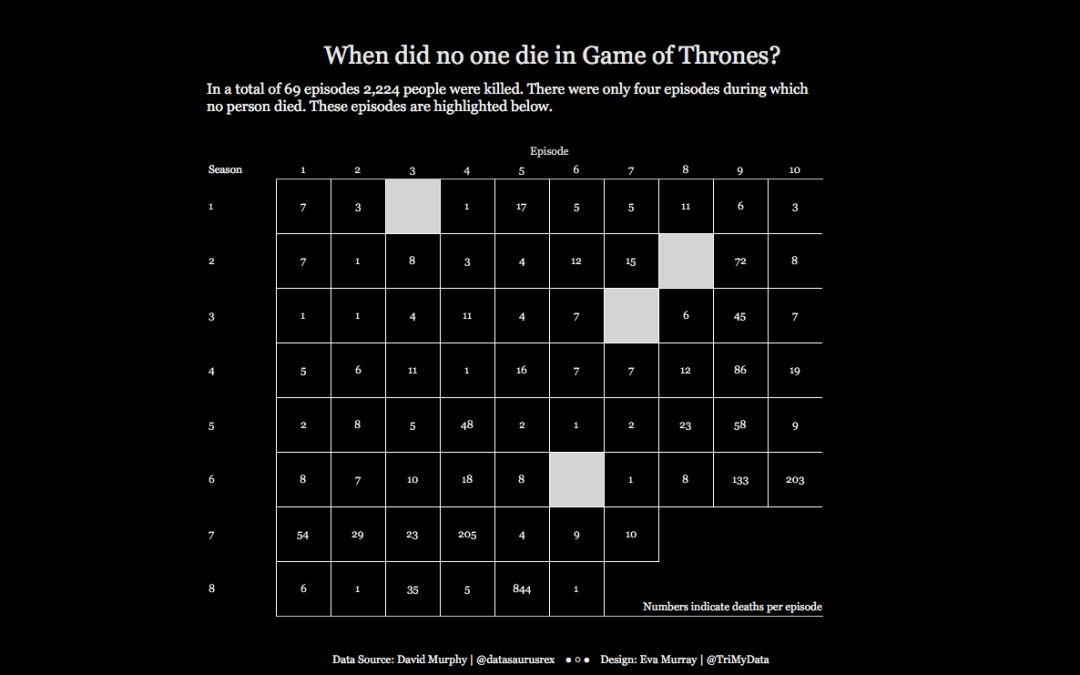
Somewhere in the middle of season 6 I stopped watching Game of Thrones and I never actually went back to it. I have to say I don’t miss it but I do understand why people are hooked to the series. This week for Makeover Monday we’re looking at deaths in GOT...
by Eva Murray | Jun 22, 2019 | Makeover Monday, Tableau
For week 25 and our #MakeoverMonday live event at Tableau Conference 2019 in Berlin, Andy picked a dataset about Air BnB ratings in the German capital. The live event was great fun and, as always, I loved meeting so many people from our community. It’s great to...