#MakeoverMonday 2020 Week 48: The success of Operation Fistula's Pilot Program
This week is another #viz5 challenge and I love seeing everyone's work come in all throughout the week. My vizzes for #Viz5 always take a bit longer because I want to get them right and today I got the chance to do my analysis while munching my lunch, and to then put to all together in an infographic this afternoon.
Here is the original dashboard, provided by the team at Operation Fistula.
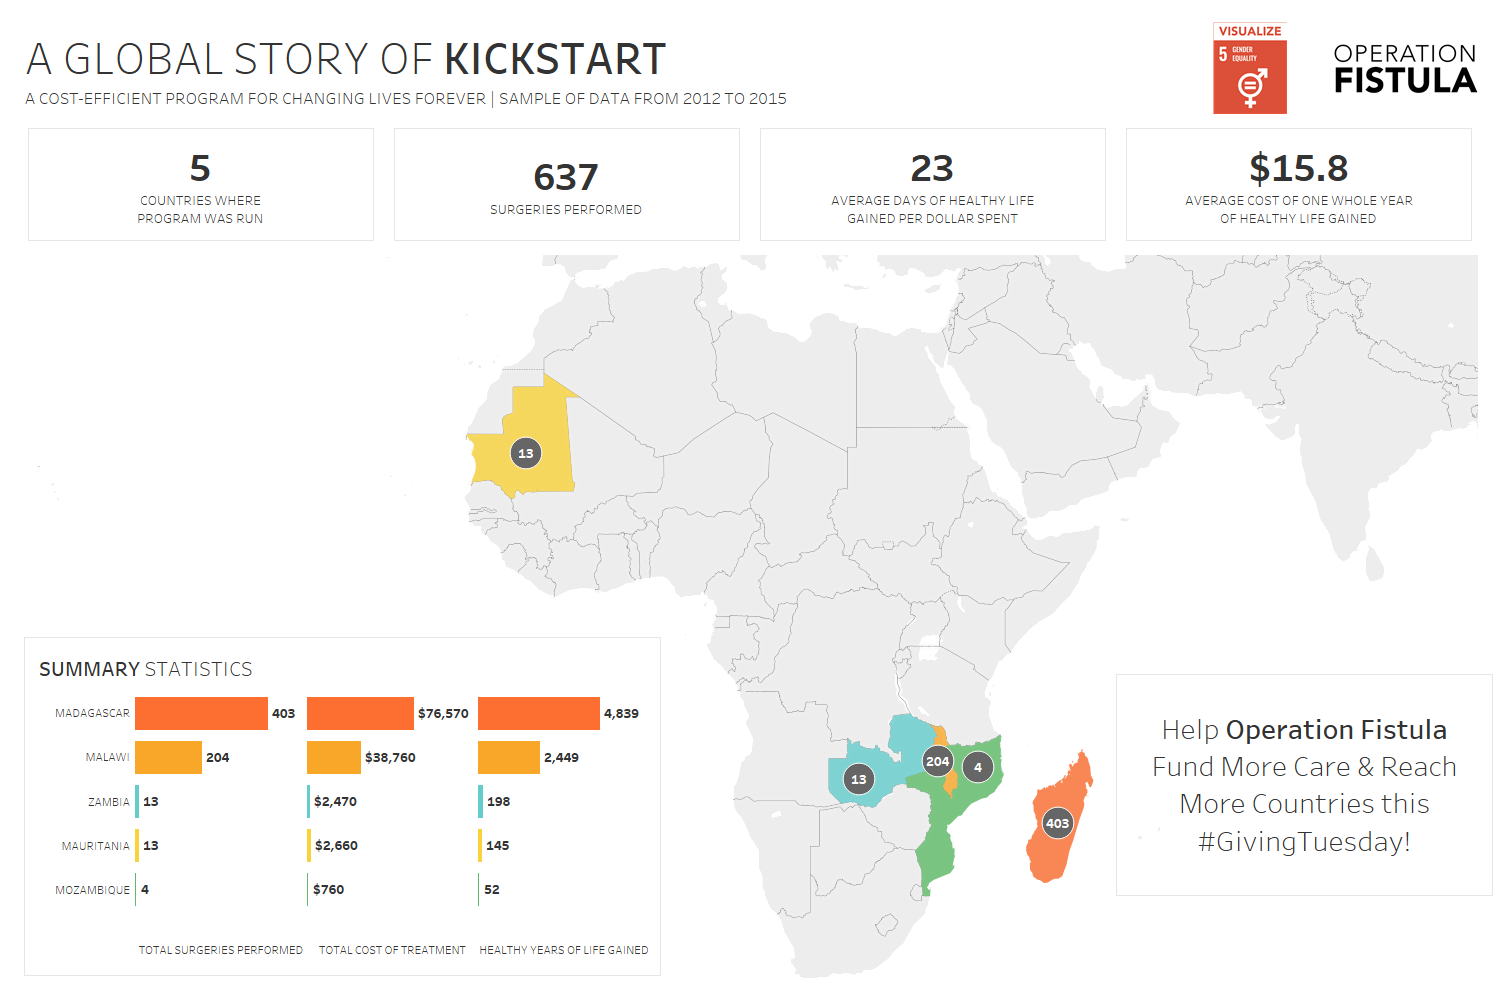
What works well:
- A nice clean dashboard with simple metrics that are easy enough to understand
- I love the inset bar chart at the bottom
- A call to action is included
What could be improved:
- The call to action could be even more prominent
- The map uses a lot of space, while the countries themselves are just a small fraction of it
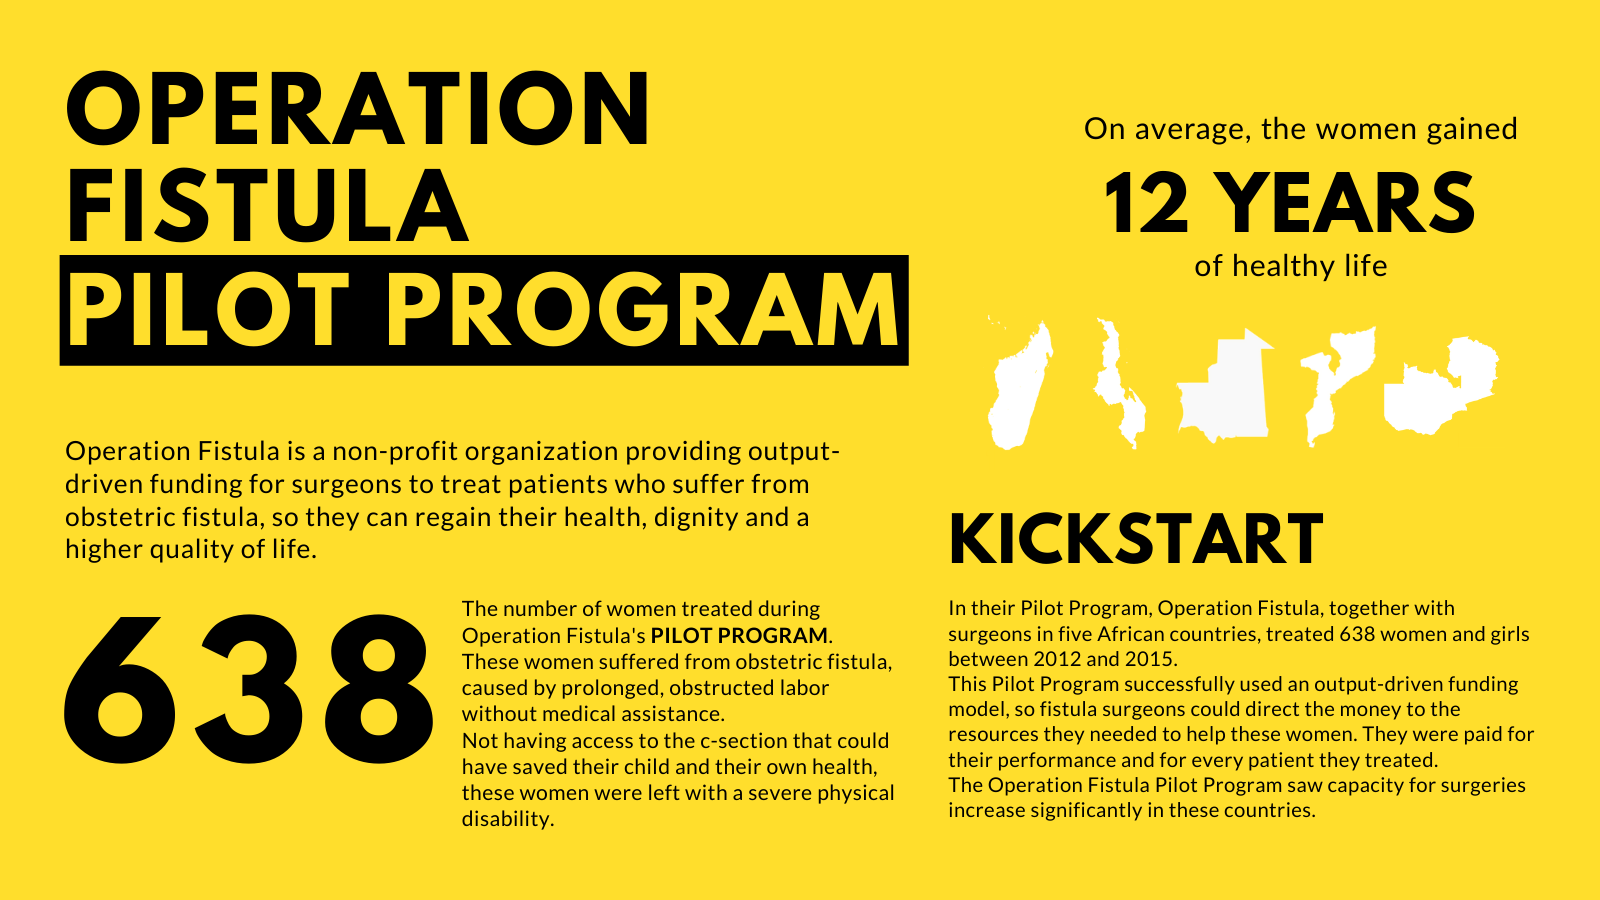
What I did:
- This week I wanted to concentrate on big, impactful numbers and create an infographic to tell the story behind the numbers.
- I did the analysis in Tableau and the design in Canva, utilising an infographic template but changing most of the elements completely.
- I chose the colors of OpFistula's social media campaign for #GivingTuesday
- Click on the image to make a donation
