#MakeoverMonday 2020 Week 25: Amazon's tiny profits explained
Fos this week's #MakeoverMonday challenge, Charlie picked a chart about Amazon's revenue vs profit from this article.

What works well:
- It's a very simple and clean line chart that is easy to read and understand.
- The title is clear and succinct.
- The lines are clearly labeled and the colors make them easy to identify.
- The gridlines are helpful.
What could be improved:
- I always find it unnecessarily confusing when the words revenue and sales are used interchangeably. The title says revenue, so I would label the grey line 'revenue' as well, instead of sales.
- The key story is on the far right, so having the $ value labels on the right would make it easier to read the charge and see the magnitude.
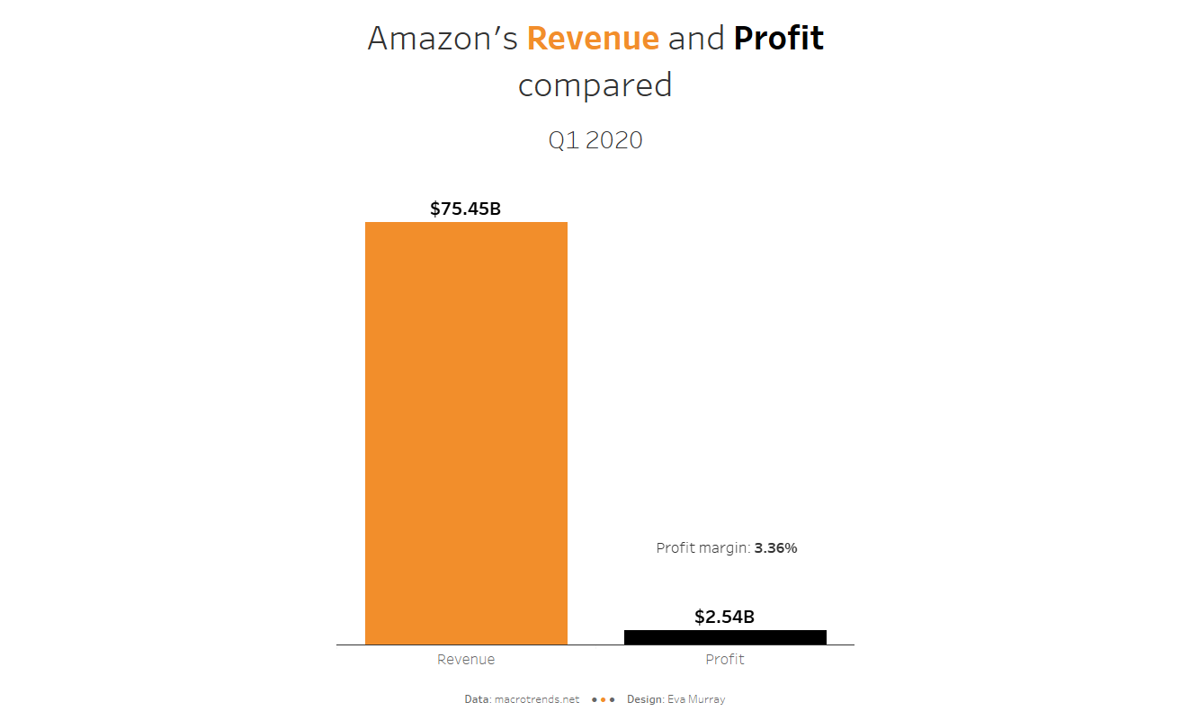
What I did:
- I played with animated bar charts and other ideas but in the end settled on something simple, focusing just on Q1 2020.
- It would, of course, be very interesting to see Q2 2020 once the numbers are available and to identify the impact of COVID on their revenue.
