#MakeoverMonday | Week 45 | 2019: Las Vegas Convention Attendance and Visitor Traffic
For week 45, Andy selected a dataset about Las Vegas. Itcontains a number of metrics, including visitor numbers, gaming revenue,occupancy rates, etc.
This is the original viz

What works well:
- The bar chart is simply and easy to read
- The line shows an interesting relationshipbetween the dip in convention attendance and visitor numbers
- The axes are labeled
What could be improved:
- There are dual axes but while they’re both inmillions, the units are not the same (one axis from 0-50m, the other from 0-7m)
- The colors are pretty bad. They’re from Excel, I’mpretty sure and they are just really unpleasant to look at
- The year labels would be much easier to read ifthey were rotated the right way up
- The gridlines add unnecessary clutter
What I did:
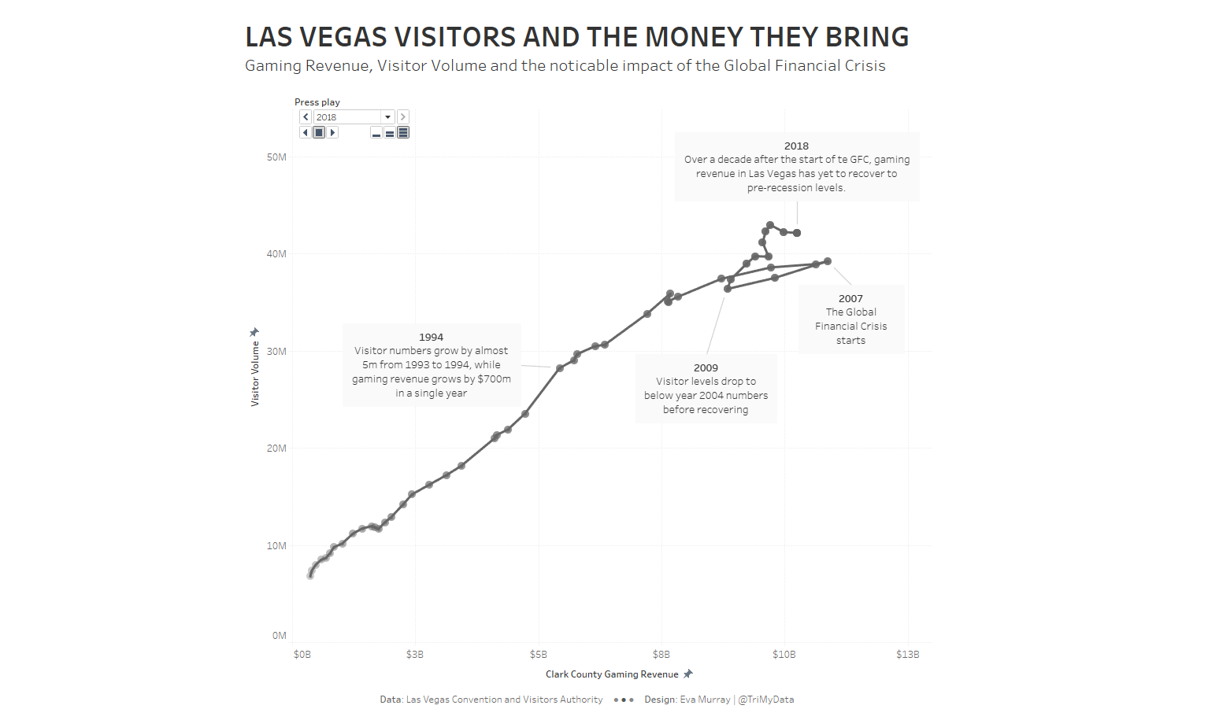
- Having a number of measures to work with, quickly led me to a scatterplot.
- Adding years and creating a connected scatterplot seemed like a logical step
- I like that the connected scatterplot so clearly shows the ‘backwards trend’ in visitor numbers and gaming revenue during the years of the financial crisis.
- I added annotations to ensure the data points that stand out are described for anyone looking at the chart
- Click here to check out my viz.
