MakeoverMonday | Week 22 | 2019: CO2 Emissions per capita
In my mind there is no bigger issue right now than that of climate change. Because it affects all of us. All 7 billion people. Yes, there are lots of other issues that need fixing in the world and we shouldn't ignore them. But we only have one planet to live on and if we screw that up, then there won't be any time or place yet to address and celebrate equality among people on various parameters.
Yet, all these things are connected.
So for this week's Makeover Monday challenge I chose a data about CO2 emissions across all countries from 1960 to today.
The original viz looks like this:
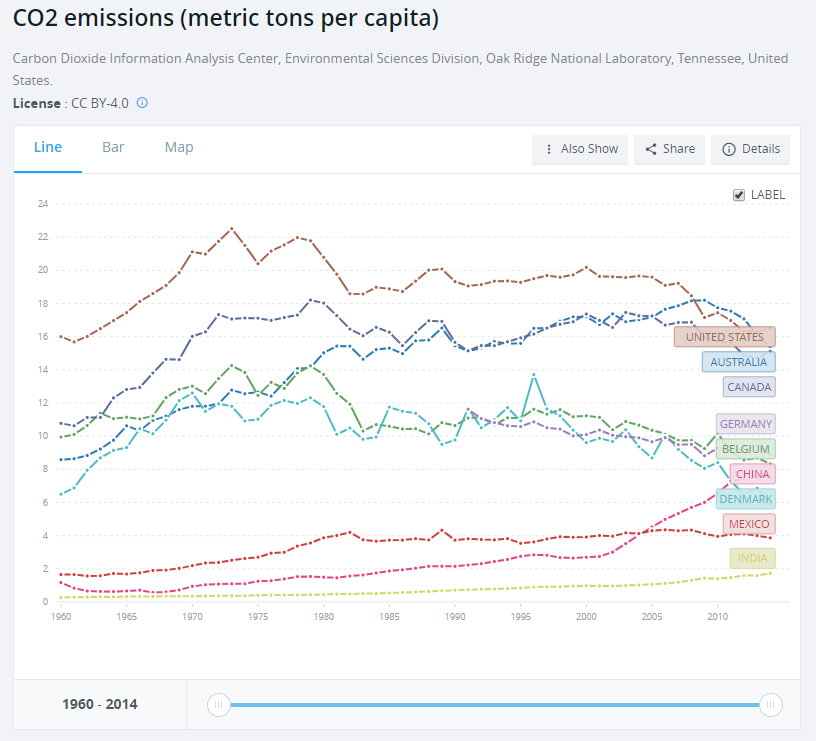
What works well:
- In the dynamic version I can add countries and regions so they are easier to compare.
- The title is short and concise.
- Using a per capita metric allows us to compare large and small countries and countries versus regions.
- The labeling is good.
What could be improved:
- Once you add a year you can't remove it unless you start from scratch again or hit 'back' in your browser.
- The colors and labels make the chart busy very quickly
- What is good and what is bad? It would be great if I could add a 'target' reference line so I can judge the results.
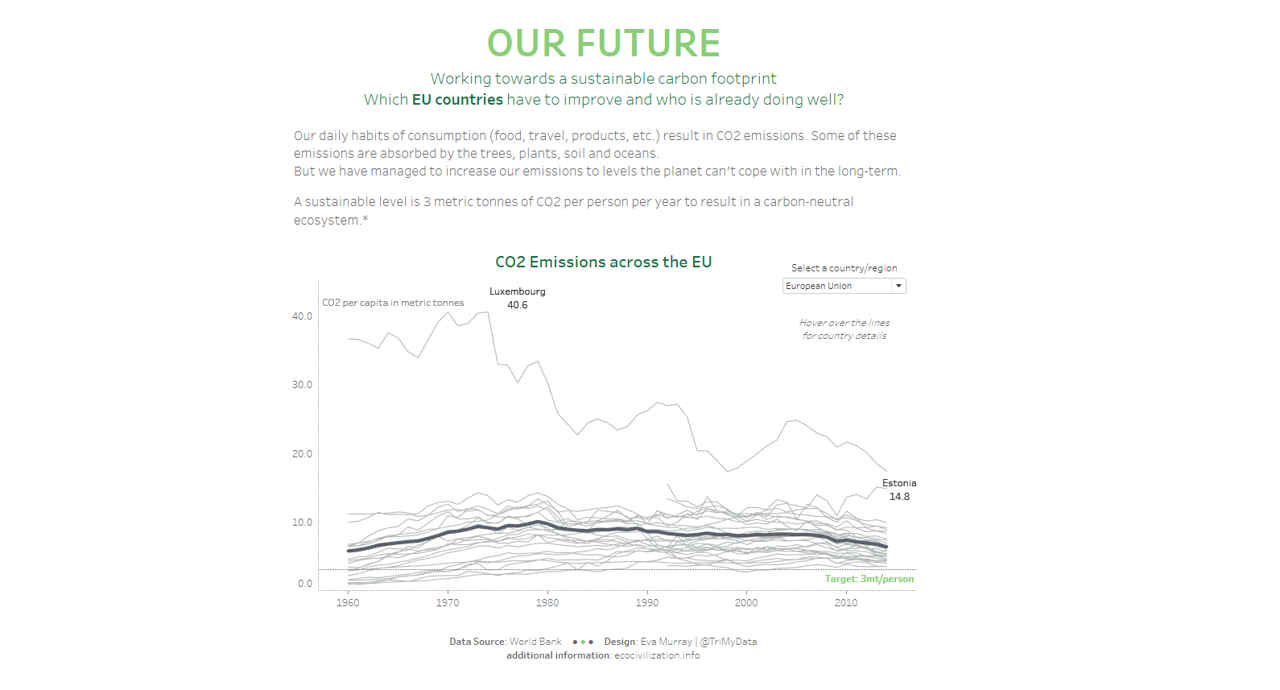
What I did:
- Focused on EU countries, including an EU average and World average for context.
- Using a parameter for highlighting on both color and size.
- Comparing to the target of 3 metric tonnes per capita (in tooltips).
- Providing a small amount of additional context about the target number.
- Click on the image to interact.
