Makeover Monday week 36, 2018: Nike Manufacturing Sites

With Tableau's release of 2018.3 beta and the density maps it gives us, we're all a bit excited to use geospatial data in novel ways.And because everyone is talking about maps, this week brings another mapping dataset for Makeover Monday.The original viz is an interactive map of countries where Nike factories are located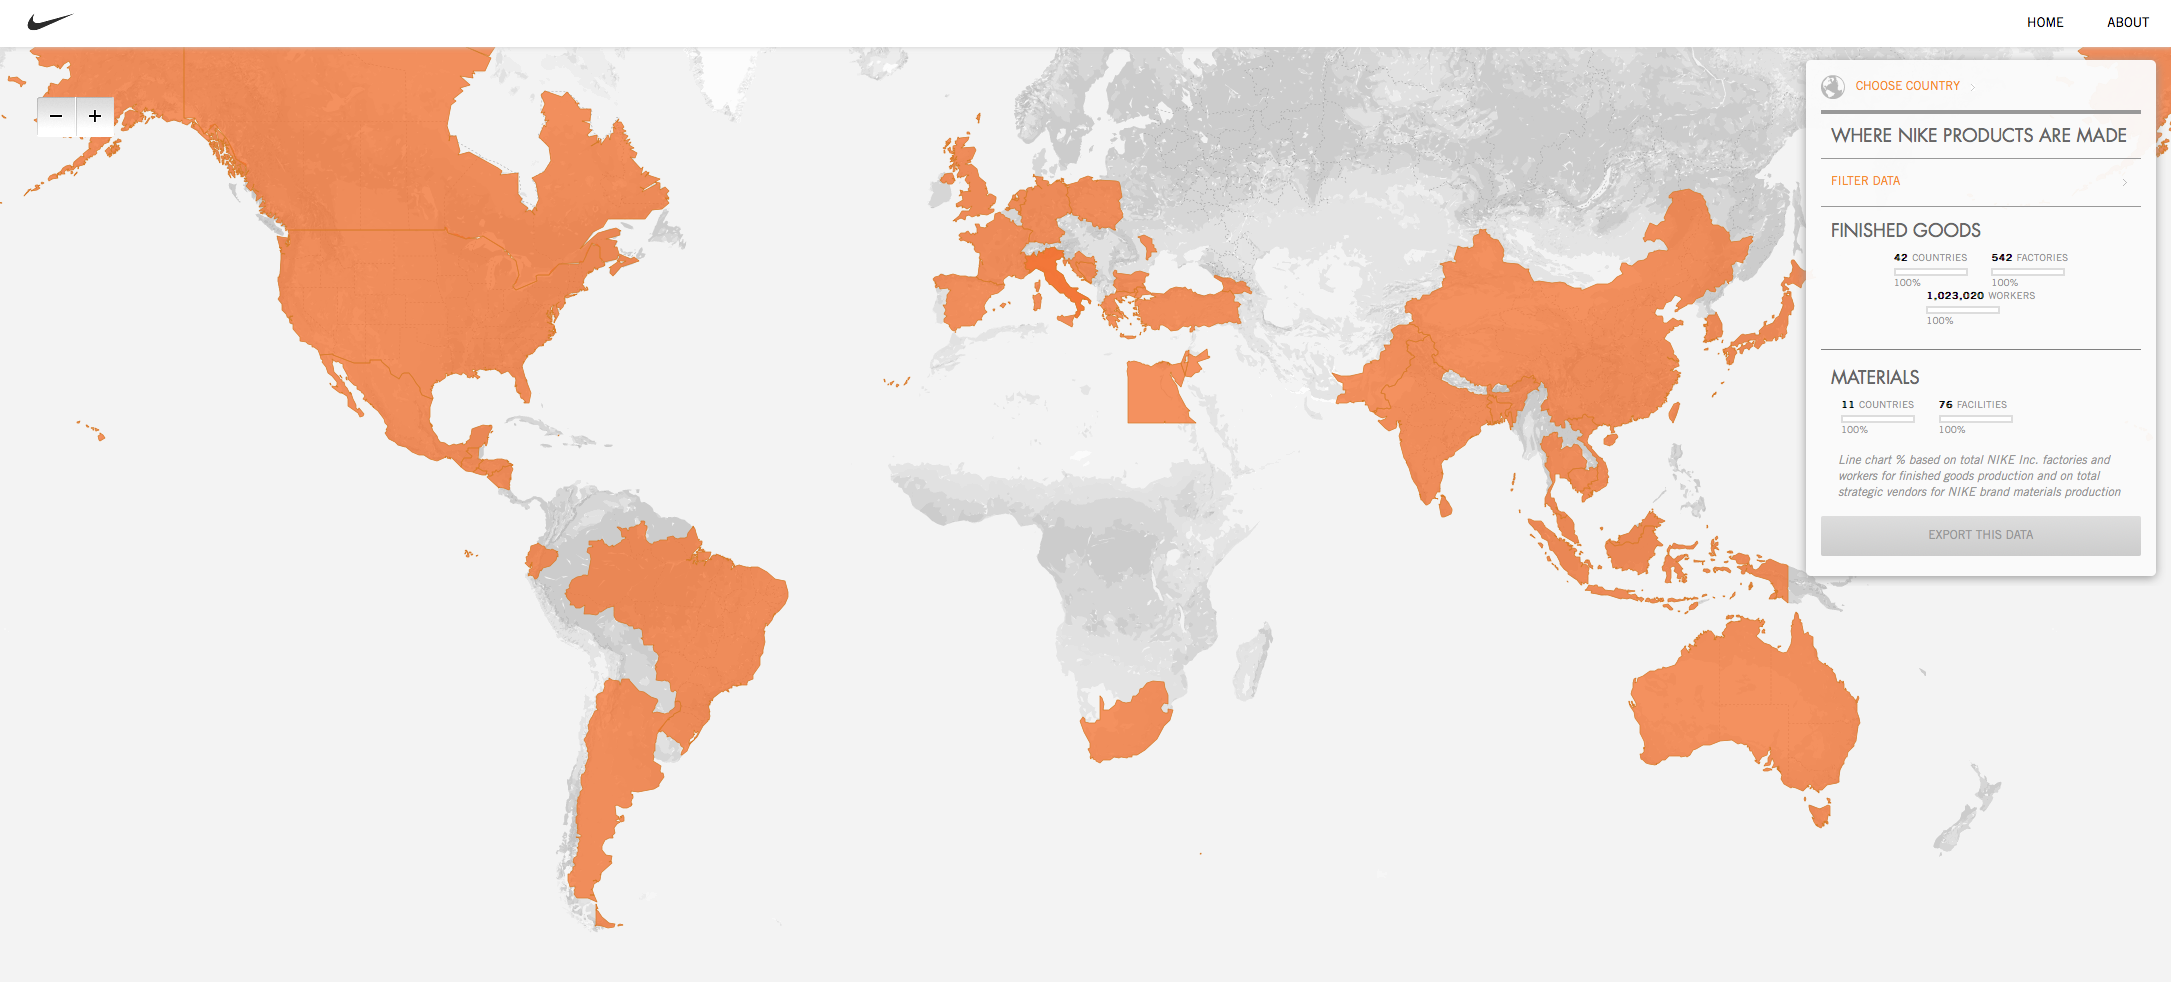
What works well:
- Giving the audience and website visitors the chance to explore the data by clicking on countries and facility locations is a good way to engage people
- The filters for countries, facilities etc. zoom the map to finer detail
- Simple colors, it is (almost) self-explanatory that the orange countries are those that have facilities, while the grey areas of the map do not have data
- Typical pan and zoom actions that are used in many online maps, work here as well, which helps people to navigate around
- The key indicators are displayed at different levels of detail
- Country selection can be done on the map or through a drop down menu
What could be improved:
- How can I compare countries or facilities? It's only ever one country or area or facility at a time. I can't compare, for example, Argentina and Indonesia.
- From the world level map I can't see the concentration of facilities in different countries. The shading only shows me that facilities exist. Indonesia has 39. Germany has 1. The map doesn't show there to be a difference
- How have things changed/improved over time? It would be great to have a time series view of this data
What I did:
- A simple bar chart in a single sheet, focusing on number of factories per country because it shows the heavy reliance of Nike on Chinese and Vietnamese factories and workers, making up more than 1/3 of their factories
- it took a lot of different vizzes to get here, because earlier today I hit a dead end and just had to leave it for a few hours before returning to the data
Click to view on Tableau Public