Our collaboration with Operation Fistula for #Viz5 is here with another dataset. This time the topic is pretty horrific, which makes it all the more important to talk about and tackle. We’re looking at FGM, female genital mutilation, and more specifically the safe houses provided by nonprofits in Tanzania for girls and women who are at risk.
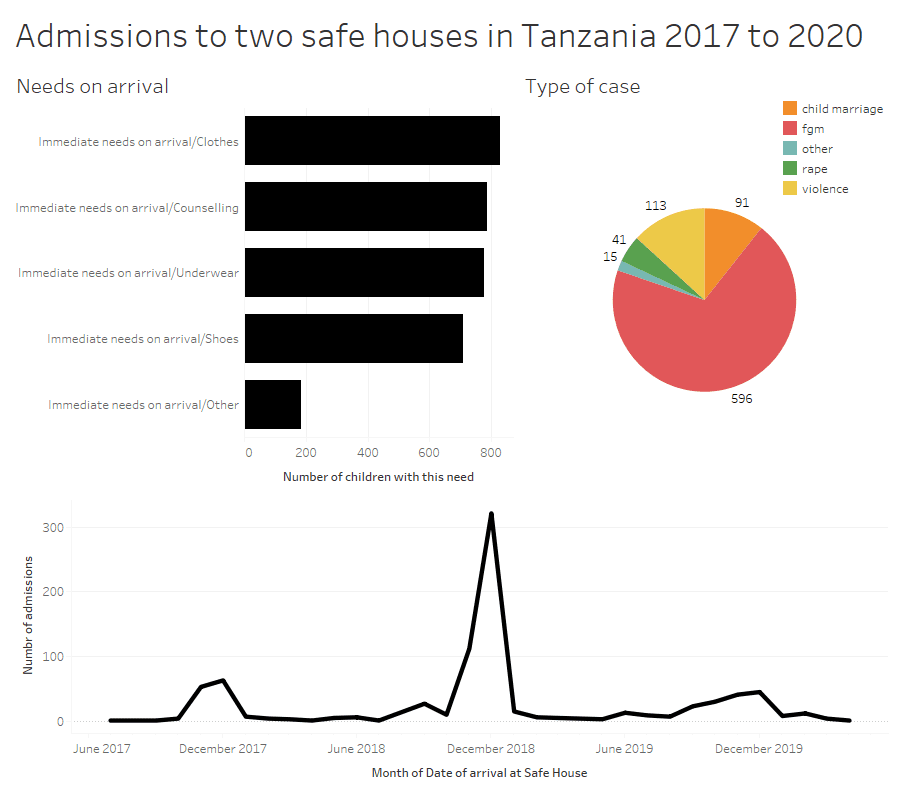
This is what the original visualization looks like:

What works well:
- The title is short and succinct
- Girls’ and womens’ needs on arrival at the safe house are listed clearly and in order of how many were in need
- The line chart makes the spike during ‘cutting season’ very clear
What could be improved:
- While the title is succinct, the topic isn’t immediately clear
- There is no call to action or clear ‘so what?’ message in the viz, which is a missed opportunity
- The pie chart isn’t as clear as it could be, there is a lot more information that could be shared and displayed effectively beyond a pie chart
- Data sources and author are not listed.
What I did:
- Viz5 challenges are always more difficult than other weeks, because the topics are hard to deal with and extra care must be taken to do justice to the data, the topic and the people and stories behind the data.
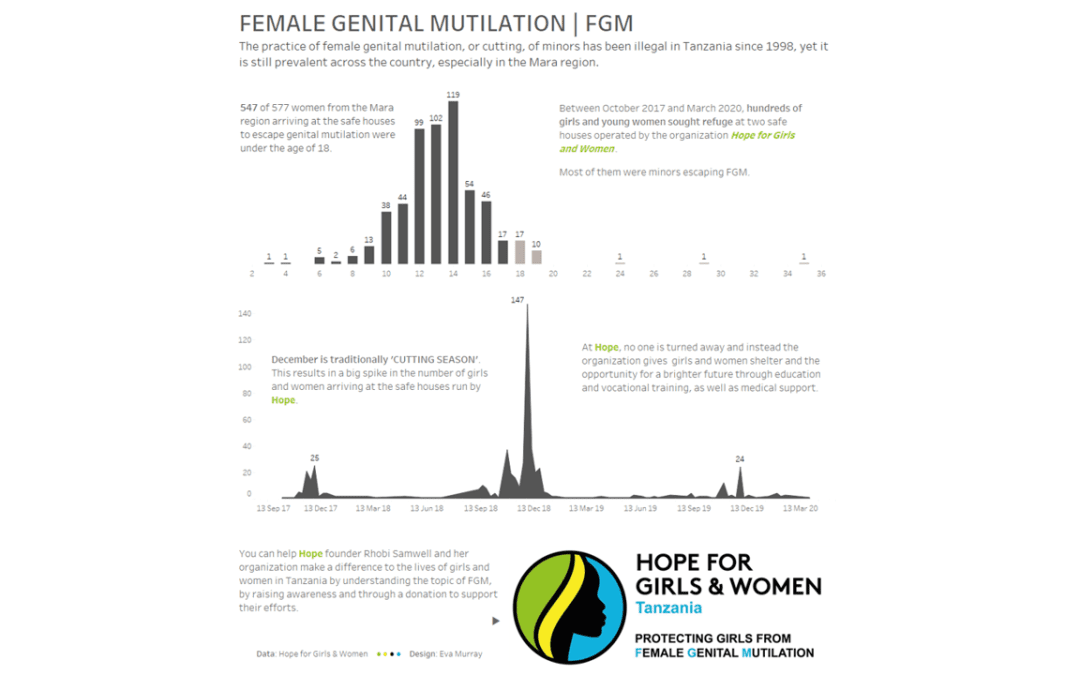
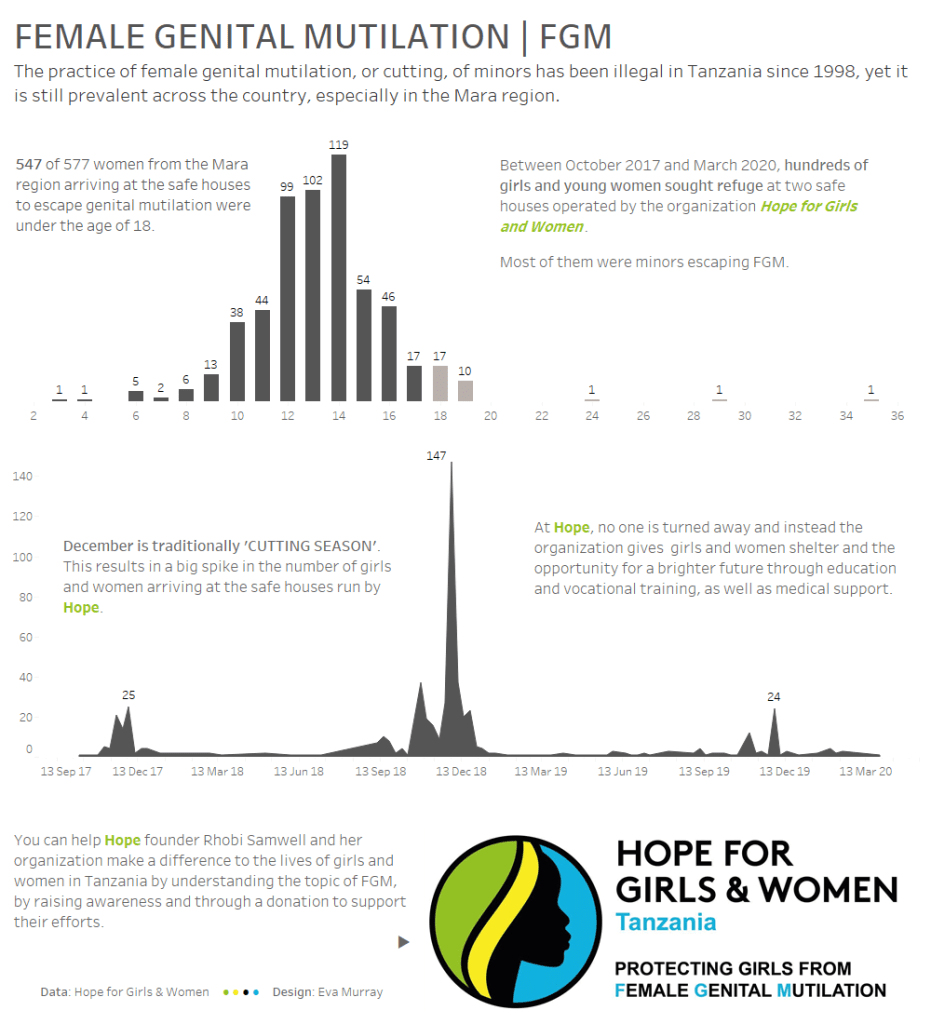
- I decided to focus on minors, on girls aged up to 18, because FGM of minors is illegal in Tanzania and has been since 1998. So aside from it being a traditional practice, it is unlawful.
- I wanted to equally try and keep the story simple and uncluttered so the message stands on its own.
- Here is my dashboard:


