This week is, much like many recent weeks, a busy one for me with many commitments that mean MakeoverMonday had to be delayed by a couple of days. But here we are, ready to build a viz about the debt of the US.
The original infographic Charlie chose for this exercise comes from here
What works well:
- The entire article is pretty informative and the visuals are generally engaging
- Nice big title
- Annotations are helpful
- big numbers and well-chosen colors
What could be improved:
- The question in the title is answered further down in the infographic, in a second chart that could potentially move higher up to provide this answer earlier
- The 3 bars on the far right are all for 2020 and suddenly bars represent months, not years – that is very confusing
- I find the dual axis chart difficult to read with the dark blue line over the red bars
What I did:
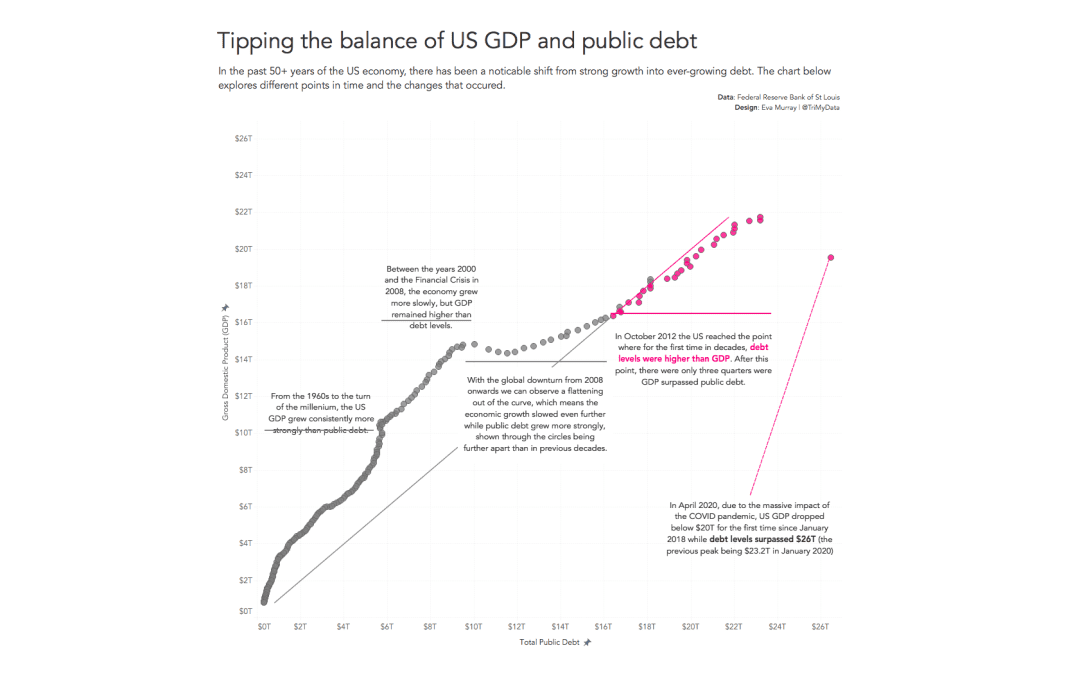
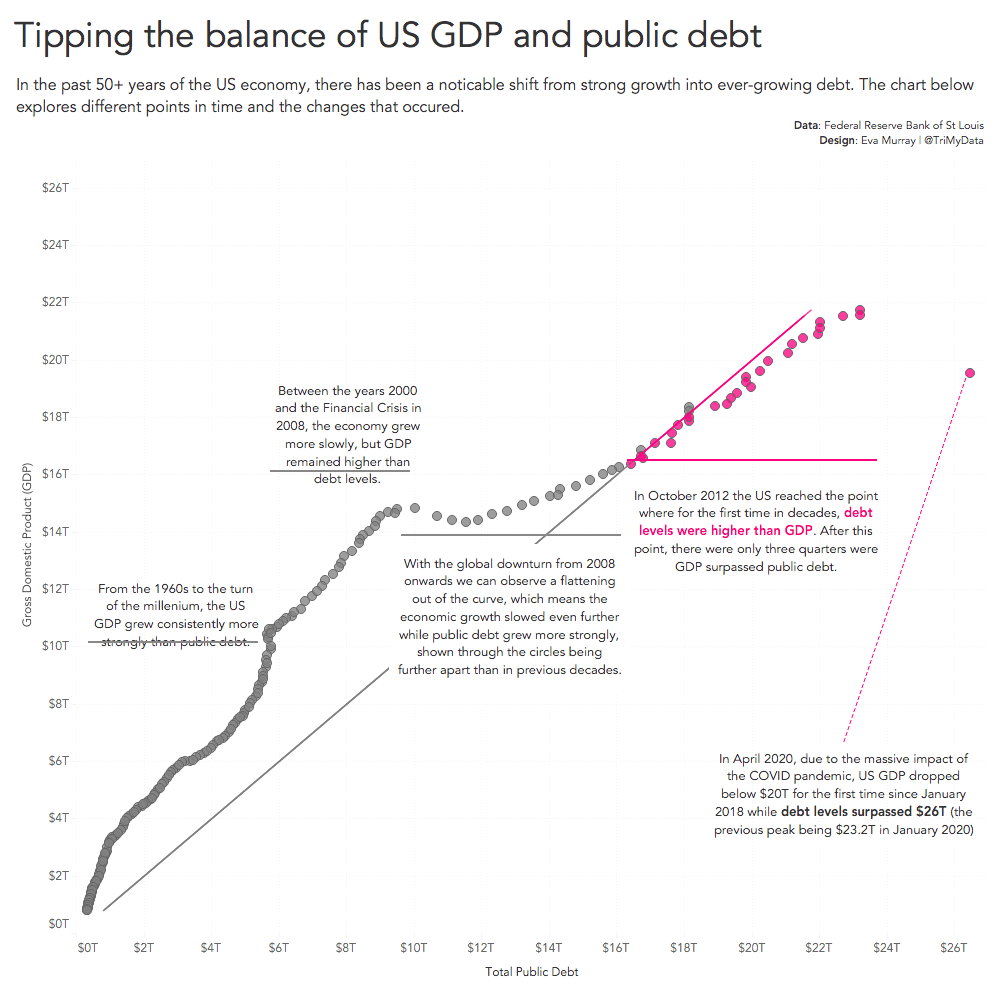
- Two measures? Surely I should do a scatterplot.
- I ended up doing exactly that with the aim to explain the differently shaped sections of the chart.
- I asked Charlie and Andy for feedback and found out mine is very similar to Andy’s – whoops!
- So here it is, click on the image for the interactive version


