September 1st is the first day of autumn, meteorologically speaking. So I picked a dataset about how Americans feel about the different seasons.
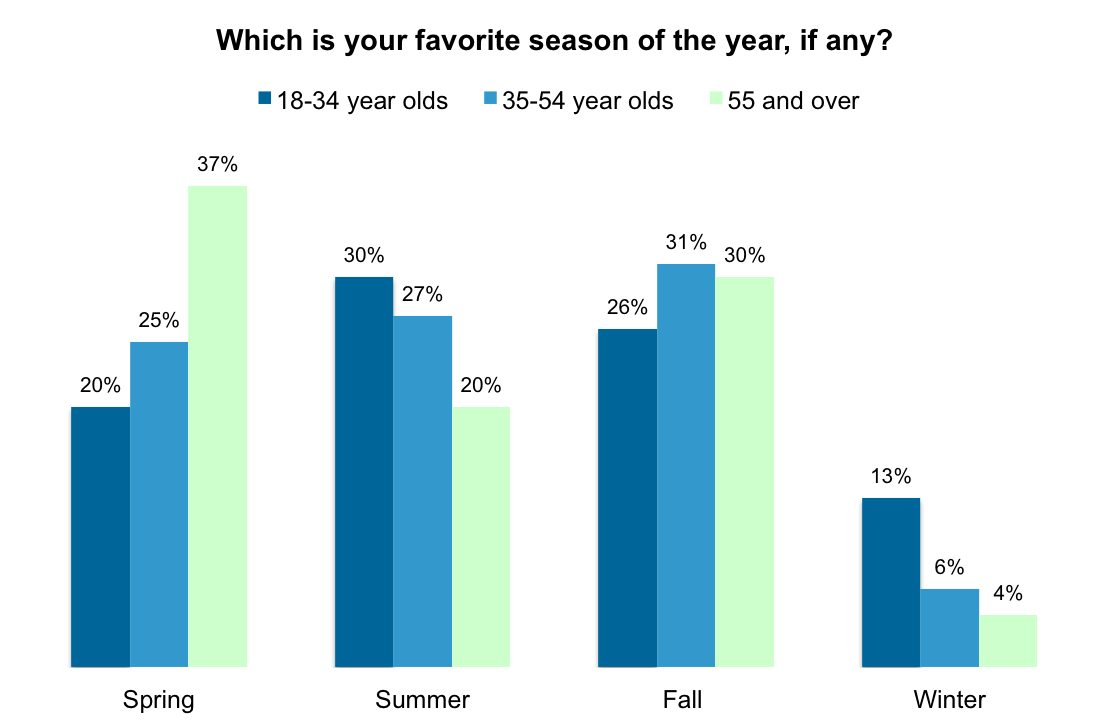
The original viz and data comes from YouGov and looks like this:

What works well:
- It’s a simple bar chart that is pretty easy to understand
- The title question is a good way to engage the audience
- The colors are simple
- Seasons and age groups are sorted in ascending order
What could be improved:
- While some bars stand out, it takes a while to really know the answer to the title question because as a reader you have to go back from the bars to the color legend
- None of the age groups’ numbers add up to 100% – why?
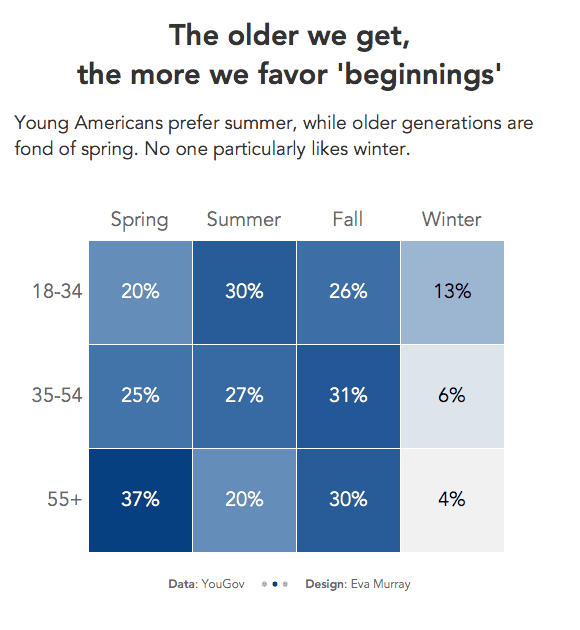
What I did:
- Back to heat maps, because I find that they provide a simple, easy to read matrix structure that lets you understand the data more easily
- Added nice big labels and worked on clean formatting


