This week’s #MakeoverMonday will be Andy’s 800th Tableau Public viz, so I decided to surprise him by picking a dataset about Arsenal, his favorite club.
While I couldn’t find an actual viz to go with it and had to simply choose a table I found online, the dataset is pretty rich and comes from the Premier League Stats Centre.
I’ve been working with lots of football data in the last 6 months, some of it public, but most of it proprietary. So I’m excited to build a viz with this data as well.
Here is the original:

What works well:
- The list can be sorted by ranking, age, nationality, etc., letting the user pick what they’re interested in.
- The player pictures help with faster recognition.
- The hyperlink for each player brings us to more information.
- The detailed values are displayed.
What could be improved:
- I don’t find this display in any way engaging.
- To compare players I need to do a lot of calculating in my head.
- I have no reference point as to what’s considered good or bad or what the average is for the different metrics.
- I’d like the option to compare players by their position, as I think that would allow for more meaningful analysis.
What I did:
- I had high hopes and could really see a grand viz in my mind. Only challenge was to actually execute it with the data I had.
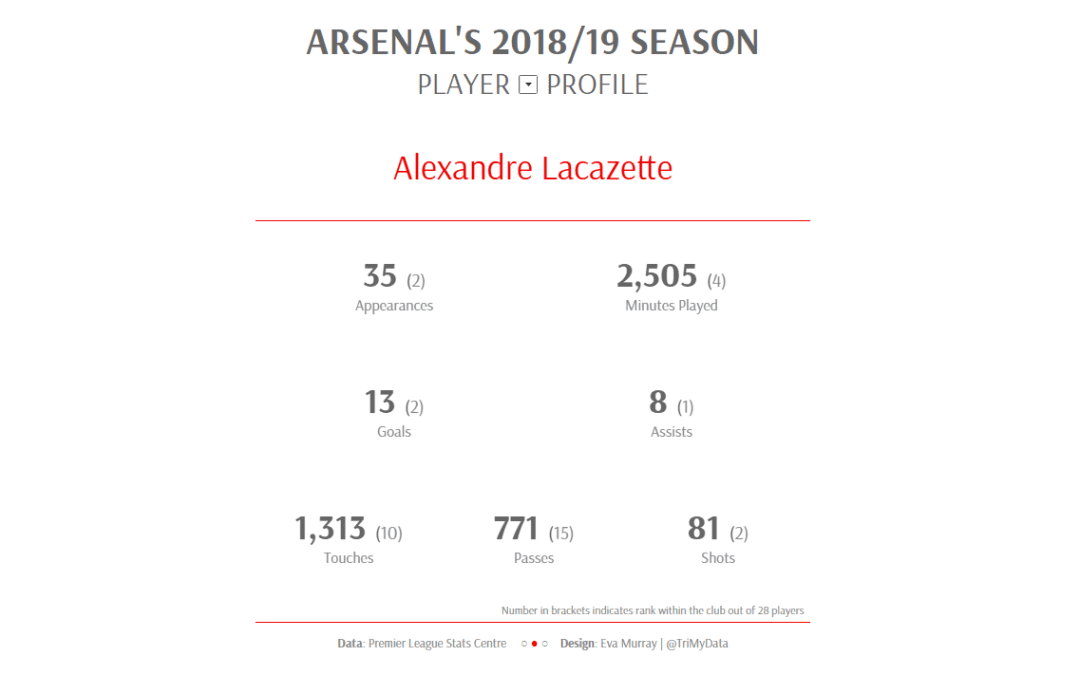
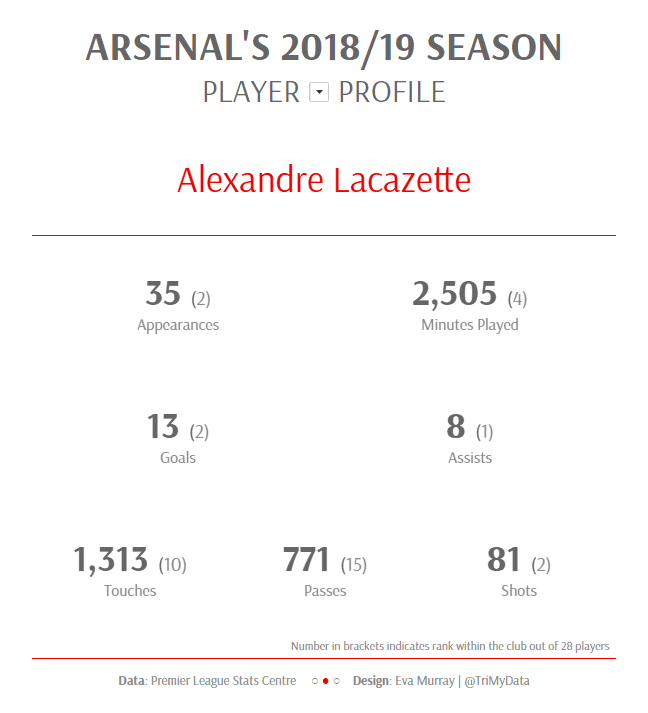
- In the end, I stuck to a very simple player profile – Thanks Andy for the updated data! – because today the moving truck came and cleared out my apartment, so my head wasn’t in the right place for deep and detailed analysis work.
- The extra touch I added was to use the Arsenal font. It’s unlikely to render on Tableau Public but at least you can see it in the image blow.
- Click on the picture to check out the interactive version and pick any player.


