For week 25 and our #MakeoverMonday live event at Tableau Conference 2019 in Berlin, Andy picked a dataset about Air BnB ratings in the German capital.
The live event was great fun and, as always, I loved meeting so many people from our community. It’s great to see some MM ‘veterans’ return time and time again and to welcome newbies to the group. Thanks to all of you who came along, who learned and participated.
My own MM viz for this week is heavily delayed as the conference is always a very busy week for me and I couldn’t get it done in time. But let’s look at the original first…

What works well:
- Maps are typically very engaging and pretty much everyone these days knows how to interact with an online map, zooming in and out and clicking and hovering for more information.
- I LOVE the information on the right-hand side. It is very in-depth but that’s intentional and the BANs really help to highlight key metrics.
- I like the social sharing buttons and the option to access the data, etc.
What could be improved:
- Red and green – why are people still using this combination? It should be banned!
- The map background distracts a bit from the data points – colorwise.
- I’d like a better title that really sets the scene.
What I did:
- I set myself the challenge to build a viz quickly, so I can take some time out this weekend 🙂
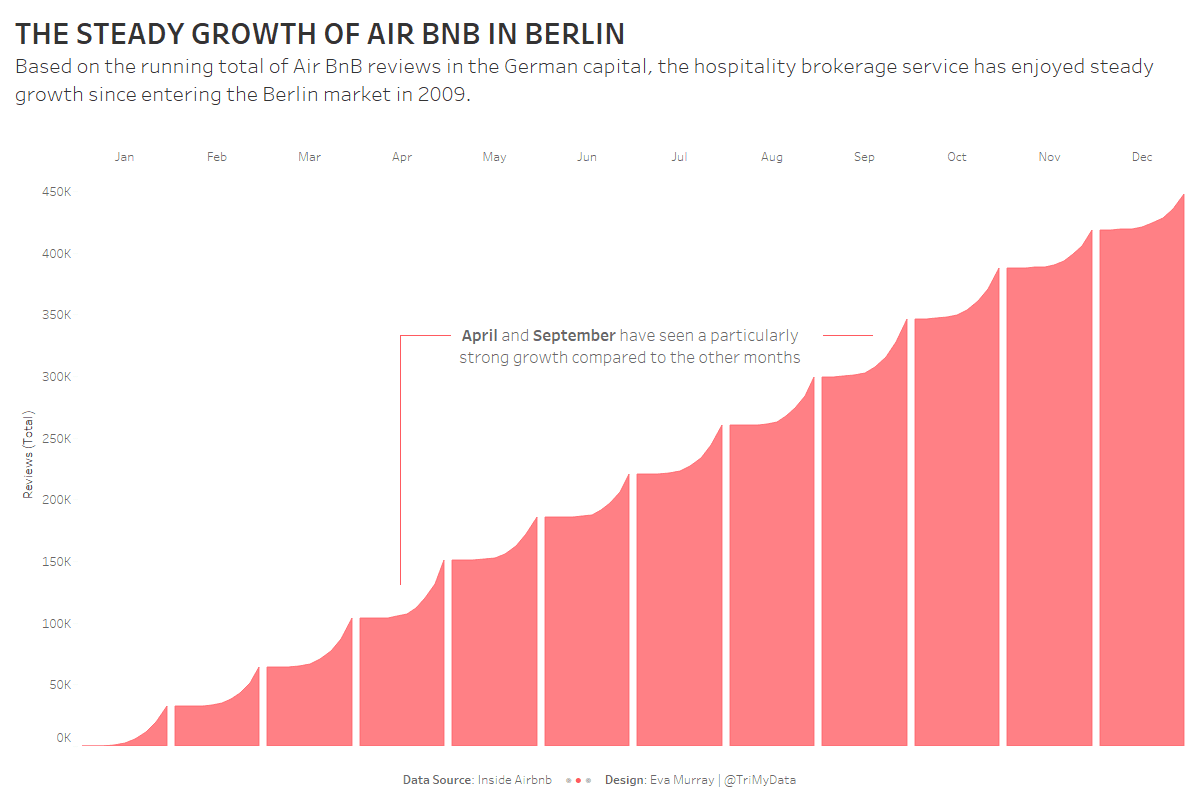
- I experimented with dates – and what I love about Tableau is how easy it is to shift and change the view simply by dragging different date fields around.
- The resulting viz looks at the steady increase of the number of reviews across the years. An increase that holds true for each month.

