For this week’s makeover, we’re collaborating with RJ Andrews on his recent book ‘Info We Trust’. RJ gave me a fun word cloud and the data behind the 270 most common word-forms in the book.
Something totally different from what we normally do, but it’s still ‘just data’ so it’s a challenge worth tackling.
Here is the original which RJ managed to produce via voyant-tools:

What works well:
- It’s engaging and many people are somewhat familiar with word clouds and how to interpret them (larger words mean they’re more signifcant in some way)
- The most frequently used word – data – does stand out quite clearly
- It actually shows all 270 words in a very condensed space
What could be improved:
- Well, there are far too many colors and they don’t seem to have a particular purpose
- It is not obvious what the viz is about, what the words relate to, etc.
- There is no title, no subtitle, no description
- Having words rotated makes them very hard to read
- Is there a meaning behind the position of each word?
What I focused on:
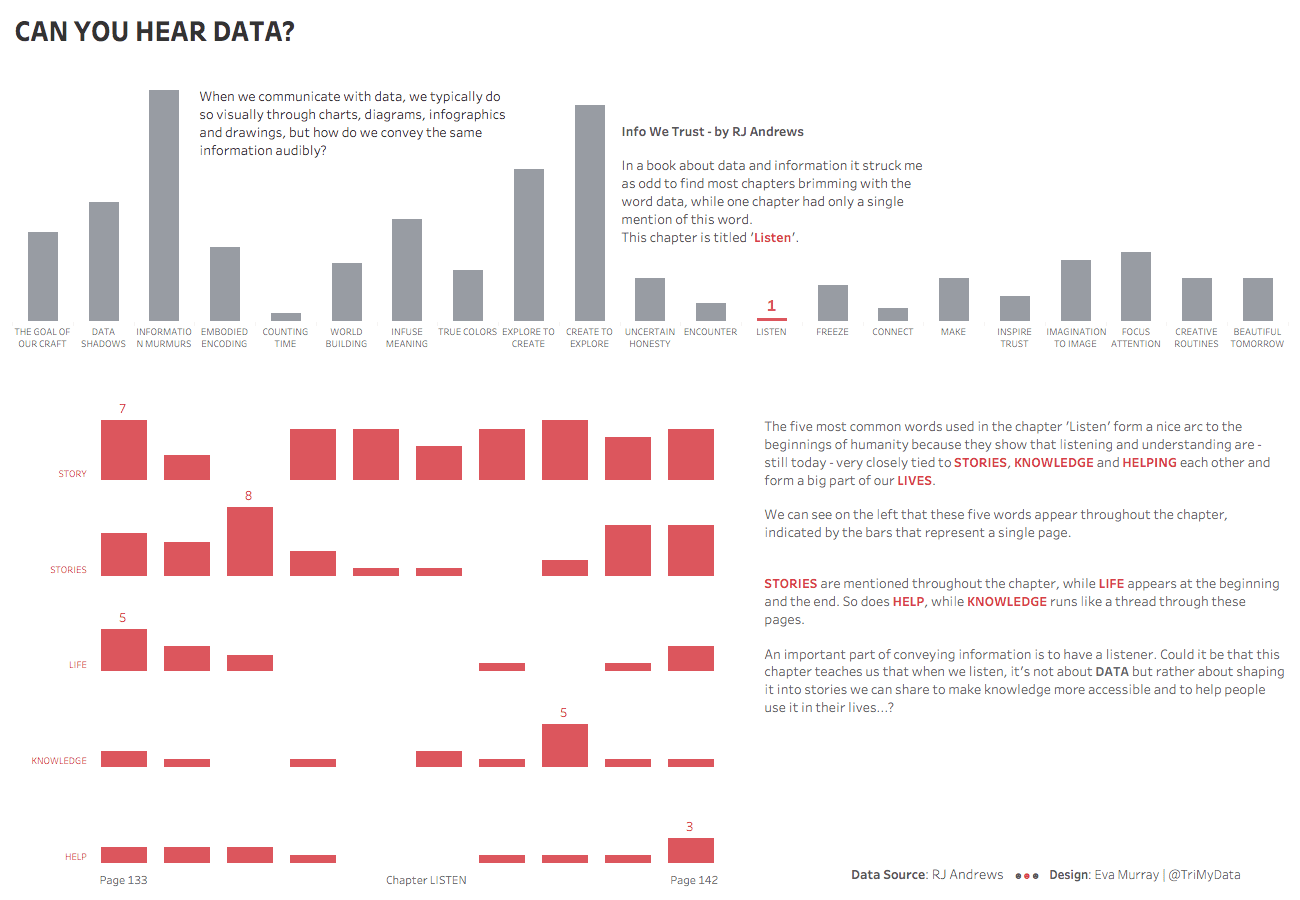
- Spending some time exploring the data
- Finding something interesting beyond word frequency
- I stumbled across word counts by chapter and noticed something that I was able to tie together into a little story. Yes it requires far more reading than I’d normally request of my audience, but there you go 🙂
- Click for the interactive version


