What a random dataset: how many women were constructors of crosswords during the Era of Will Shortz.
I like these topics that come completely unexpected and force me to learn something first before tackling the data. Admittedly, I’ve never spent a single thought on who is behind these creations for newspapers, websites, magazines, etc.
Now I know about the legend called Will Shortz and I’ve learned that creating crosswords is yet another area which seems to be dominated by men, whatever the reasons behind it.
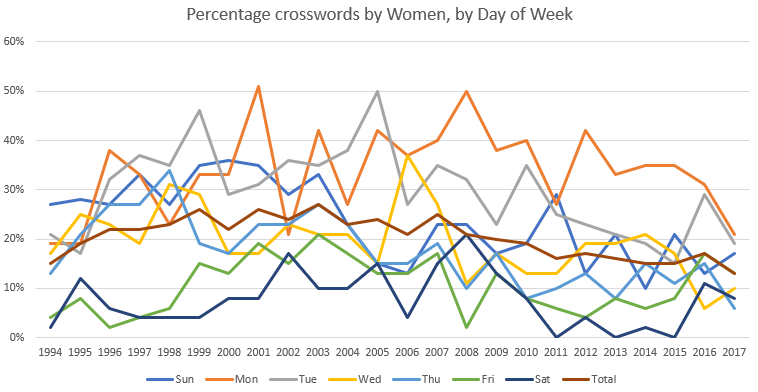
The original viz for this week comes from XWord Info:

What works well:
- Horizontal timeline
- Neat gridlines for each 10% step
- Logical sort order of the color legend
- Using percentages
What could be improved:
- There are too many colors, so it’s difficult to see where the lines are going
- Having the y-axis go to 100% could be a good way to show how low the actual percentages for women are
- The title isn’t very informative and would benefit from a bit more detail
- It would be great to have some insights as part of the viz, as the mix of lines makes it hard to come to conclusions
What I did:
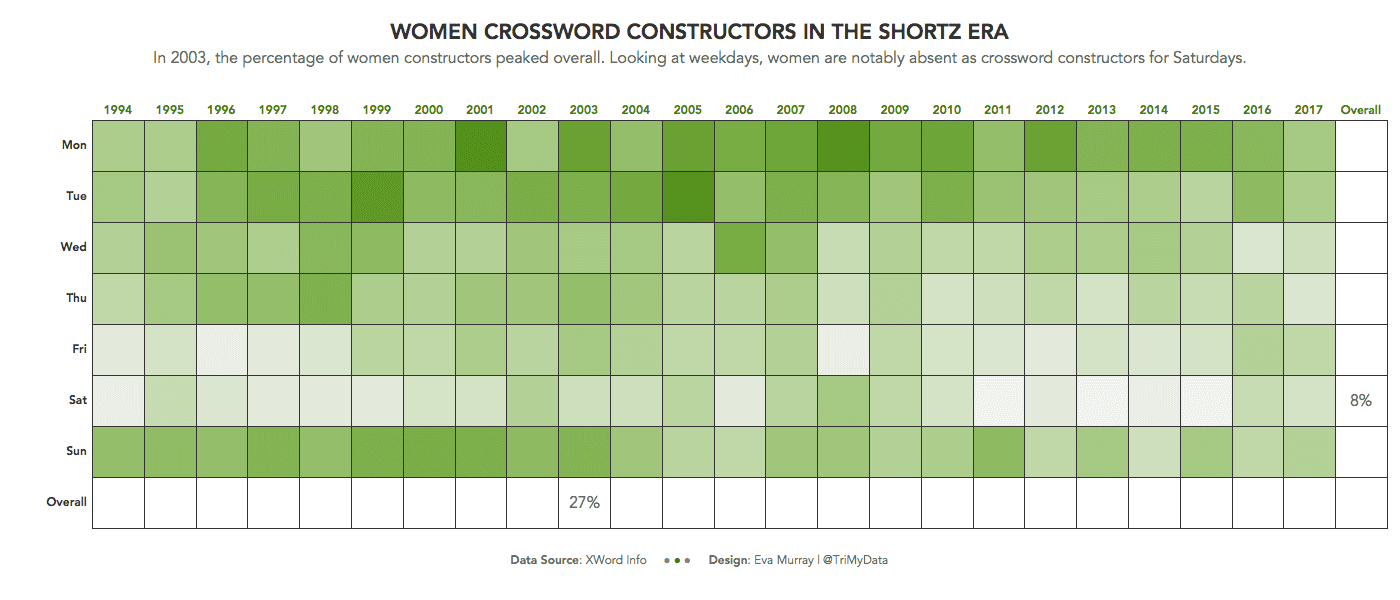
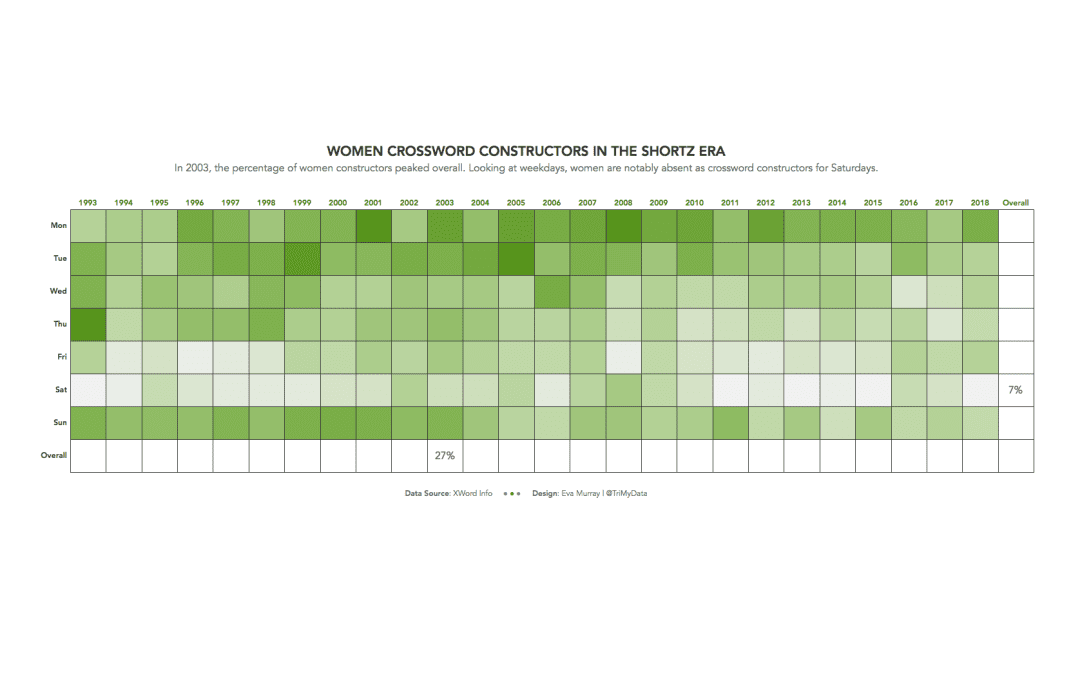
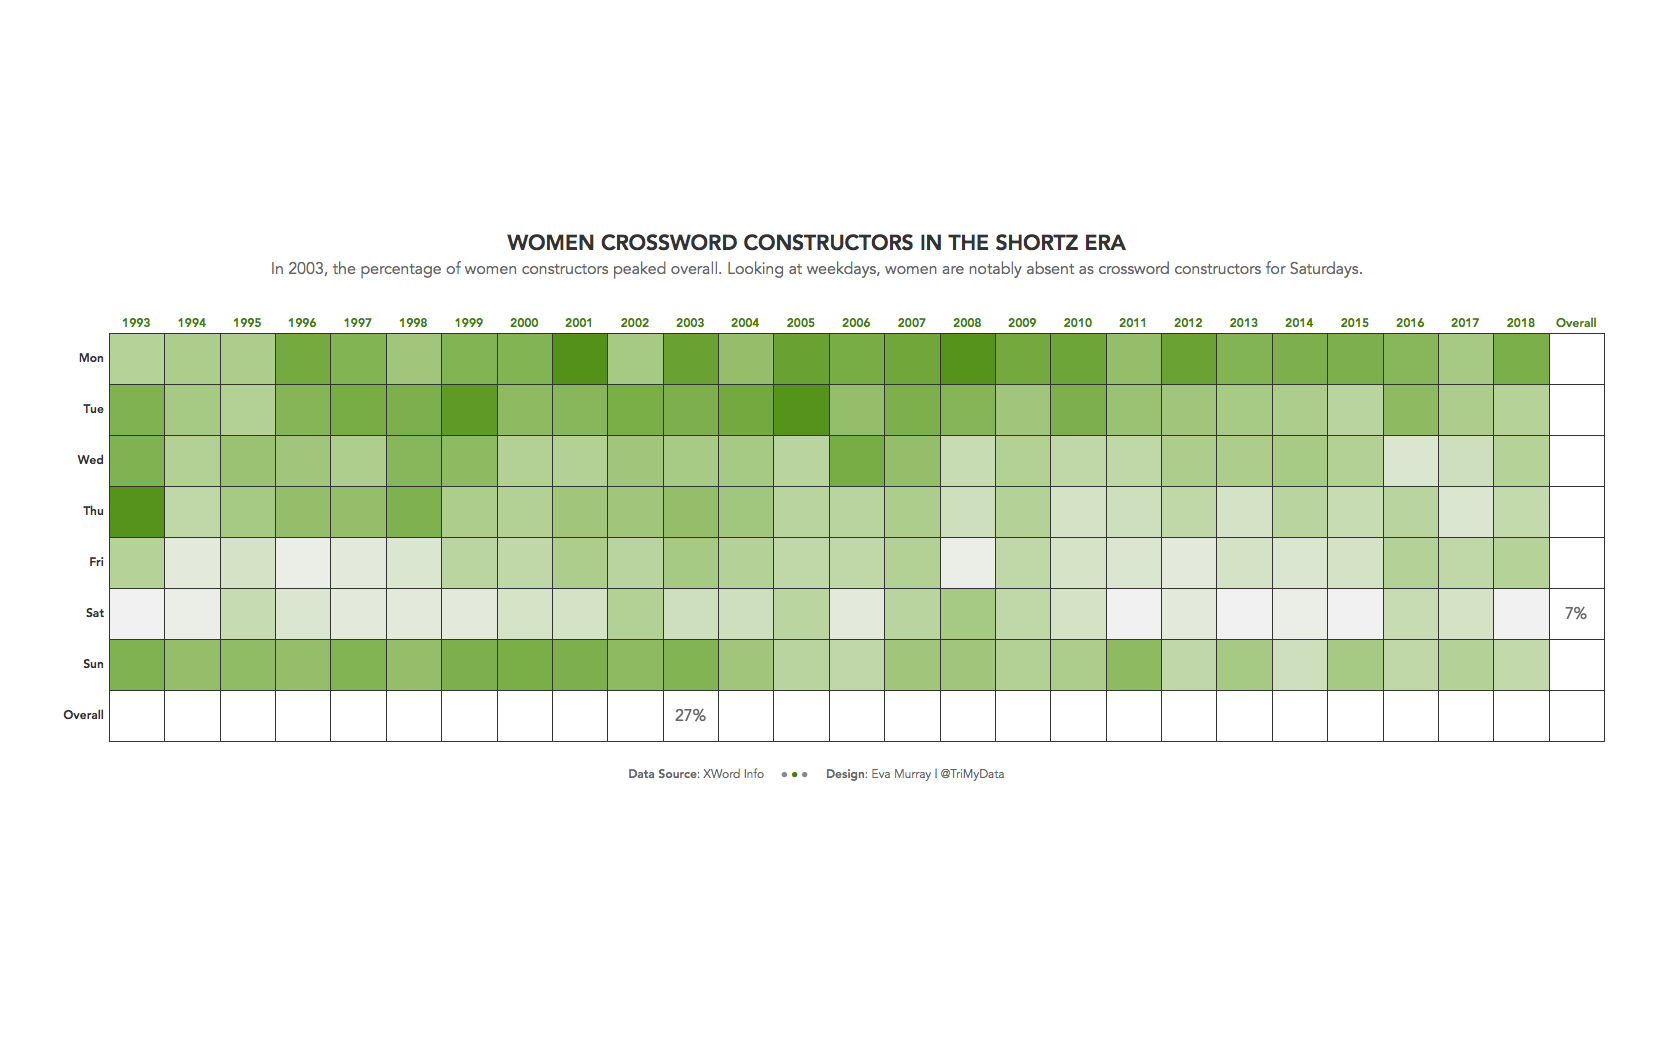
- I have become a huge fan of heat maps, so that’s what I built
- Weekday and Years, Weekday and Months, Weekday and hour of the day – all of these make me think: I could use a heat map for that!
- Check the interactive viz here


