TC18 is finally upon us and we’re getting ready for a week of data and viz fun. Among the preparations for TC is getting this week’s Makeover done early. It’s actually Thursday evening, 18th of October, as I’m writing this and yes, I’m done with my viz.As much as Andy and I would enjoy doing the viz live with everyone else, there simply is no time during events because we’d rather walk around and talk to participants, help them, get their feedback and answer their questions. So we get a head start :-).For this year’s TC Makeover, Andy chose to go down memory lane and picked his first ever Makeover Monday viz which was about Major League Baseball beer prices.
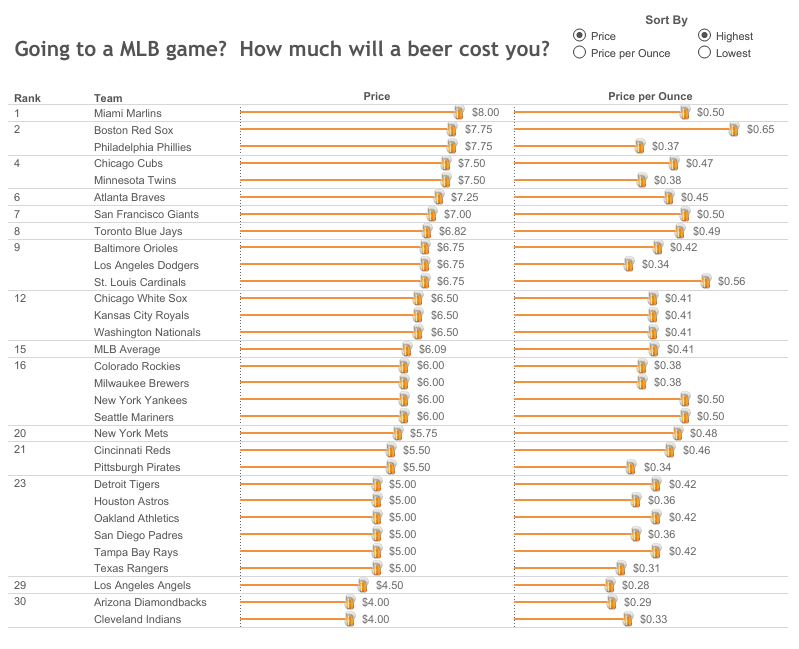
What works well:
- Flexible sorting
- Engaging title questions
- Both charts have a purpose
- Labels show the exact price
What could be improved:
- What timeframe does this data relate to?
- The data source and author details should be included
- The icons are unnecessary, a simple bar chart instead of the icon lollipop would work better
- Are the beers the same price at all the different clubs/stadiums?
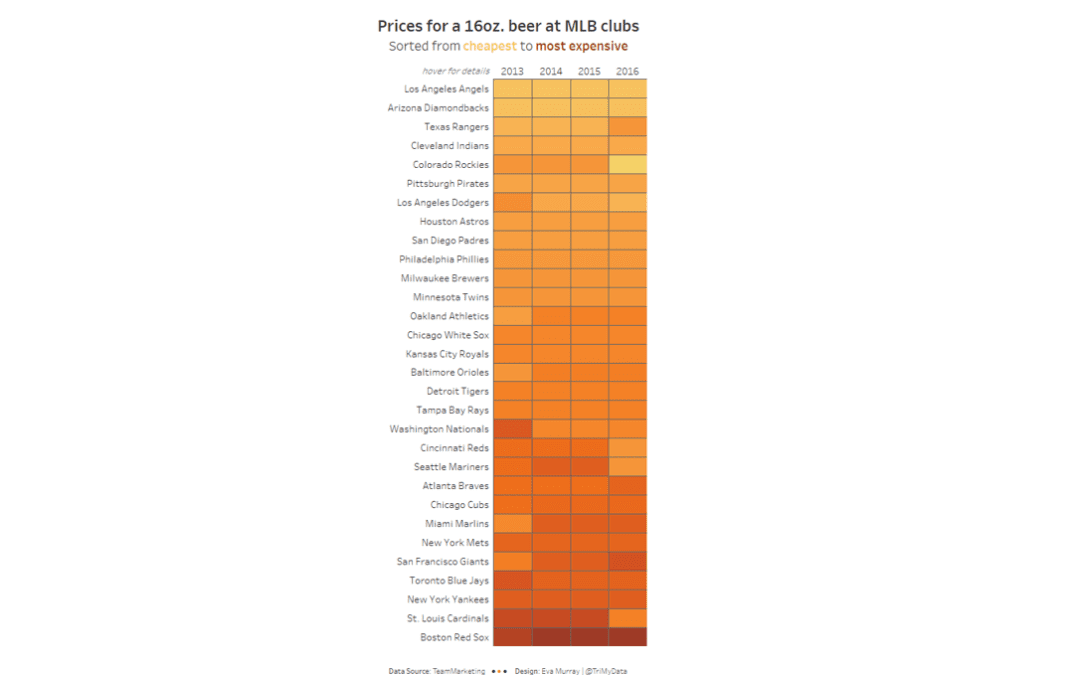
What I did:
- Went through a few different chart options, including spark lines and small multiples
- Settled for a heatmap. I’m really fond of heatmaps 🙂
- Decided to sort teams by price per 16 oz. which resulted in a beer-esque look of the heatmap


