A couple of weeks ago, Sarah Bartlett shared a link to the viz we’re using for this week’s makeover.What’s great is that the dataset is very simple, one dimension and one measure.No doubt there will be richer datasets in the future but what Andy and I need this is week as we get ready to submit the manuscript for our book on Friday is something nice and simple that will not require much input from our side.Yes sometimes we have to be a big selfish. Don’t worry, though, the lineup of topics is fun, diverse and will give you plenty of opportunities to challenge yourself :-).Let’s look at week 22’s viz:
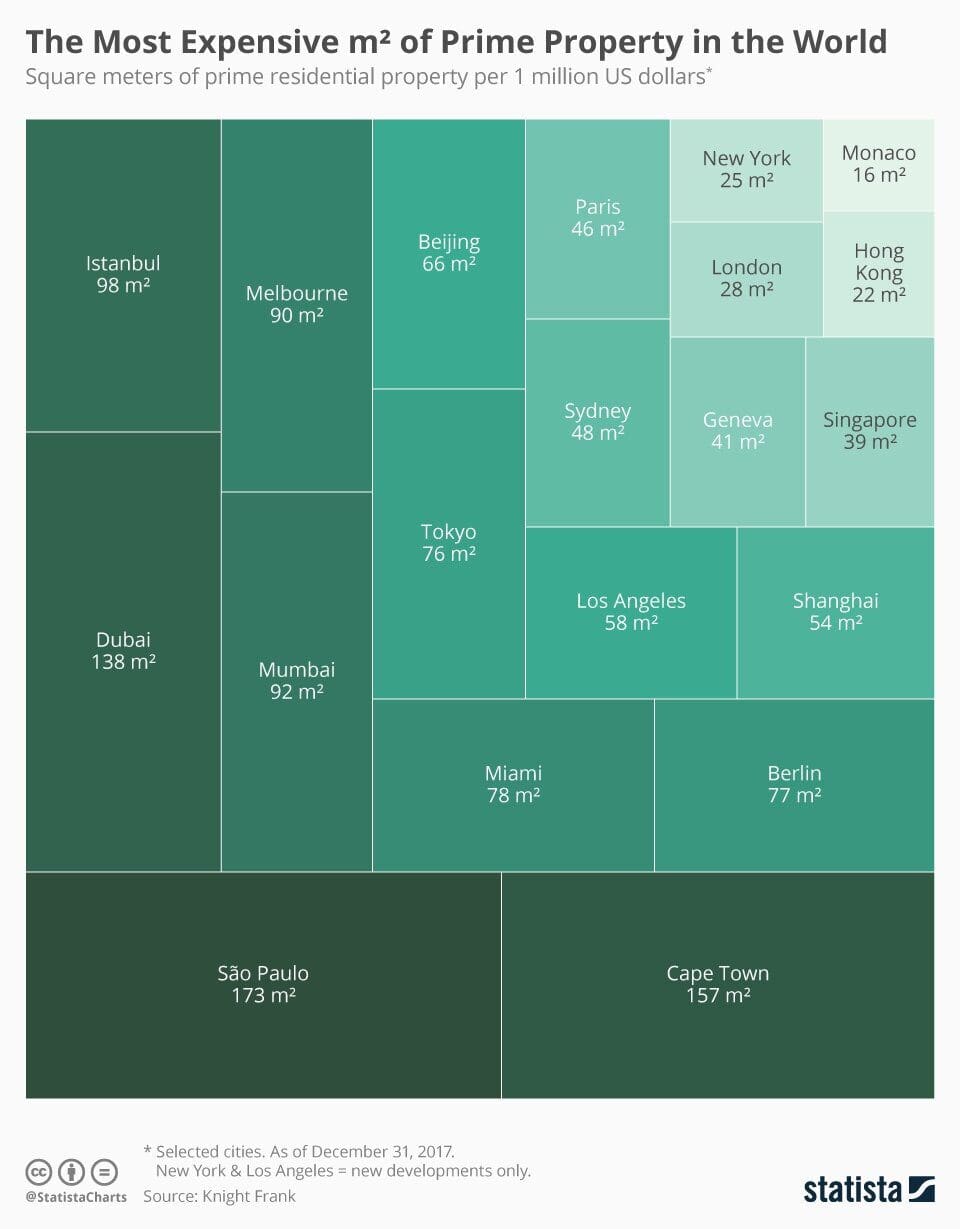
What works well:
- The sizes show clear differences between the cities
- The title and subtitle are clear and descriptive
- Sources are stated and clarification is provided regarding the cities included
- The treemap shape lends itself to the topic which looks at the floor area of properties
- The labels are clearly visible and including the actual property size helps put things in perspective
What could be improved:
- A treemap should show parts to the whole. This treemap contains selected cities, so it’s very unclear what kind of ‘whole’ thing we’re talking about
- Comparing the sizes of individual shapes is very difficult because the layout has some cities as horizontal rectangles and others as vertical ones
- The color gradient leads to double encoding where larger rectangles are darker than small rectangles. This makes them appear even more prominent in the viz which could be deliberate
- Given that the price reference is in US$, it would make more sense to have the property size in square feet. Even though square feet are a weird measure to me an something I cannot relate to at all. It would be great to have the option to swap the measure unit between square meters and feet
What I did:
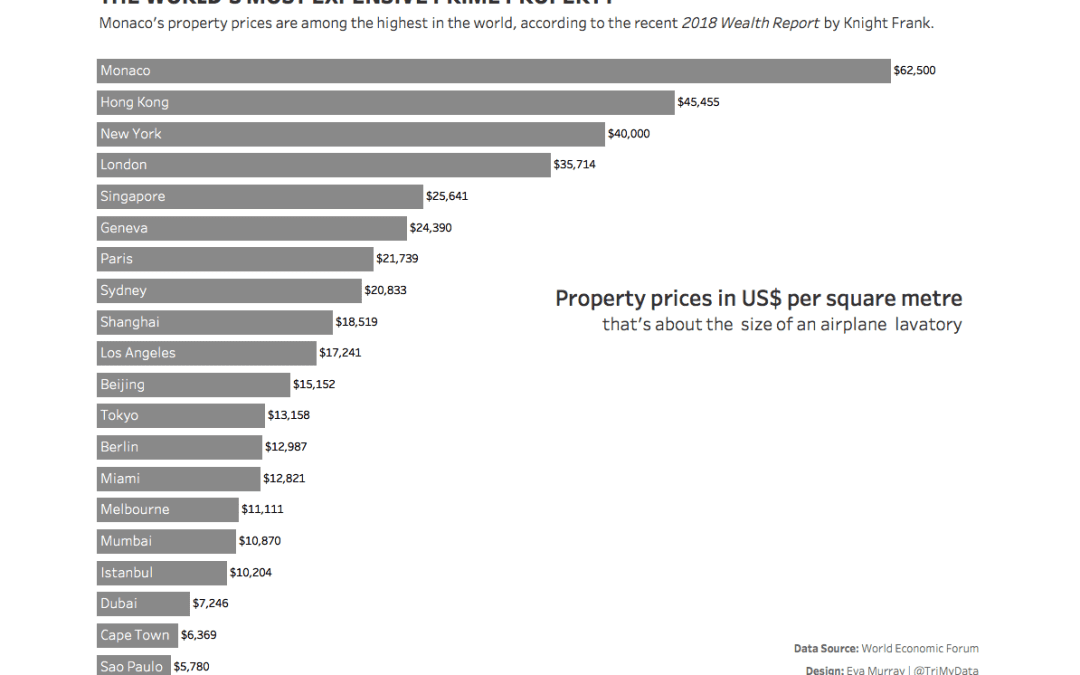
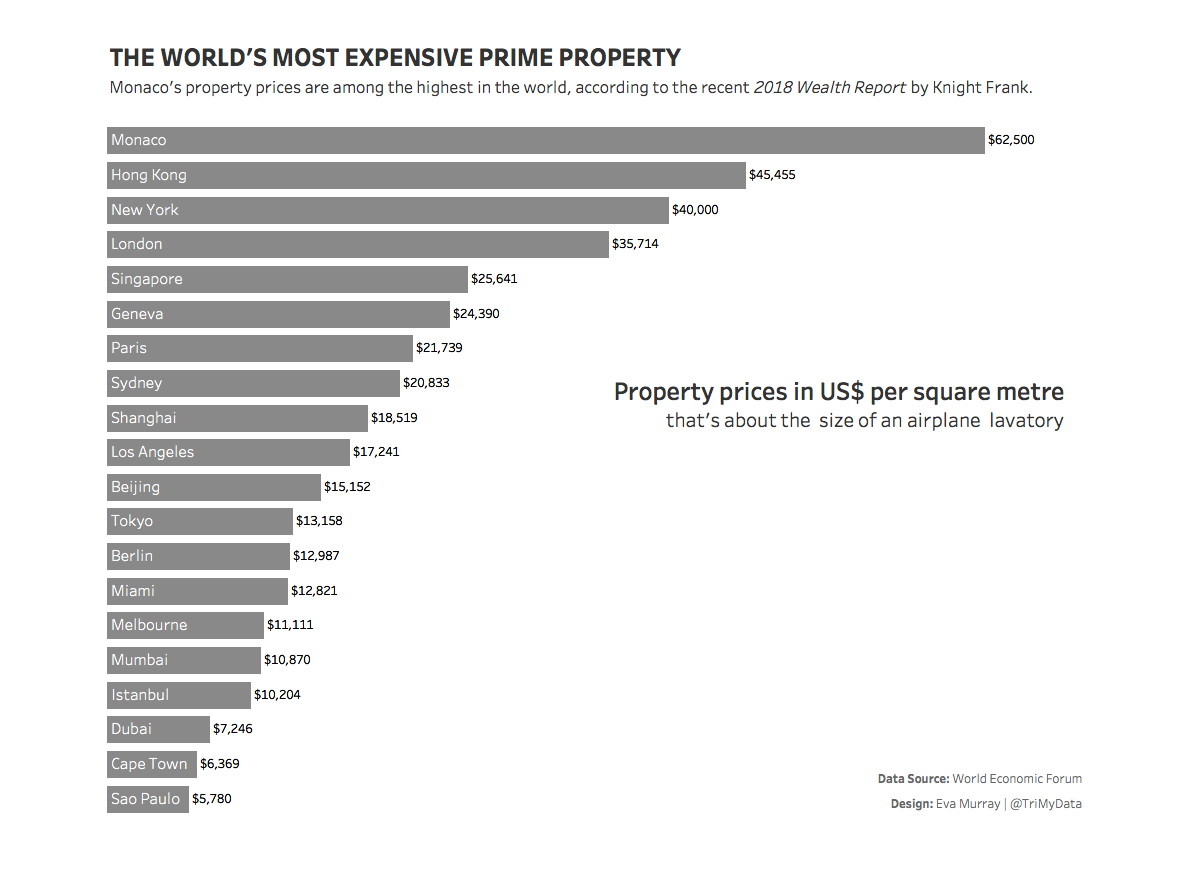
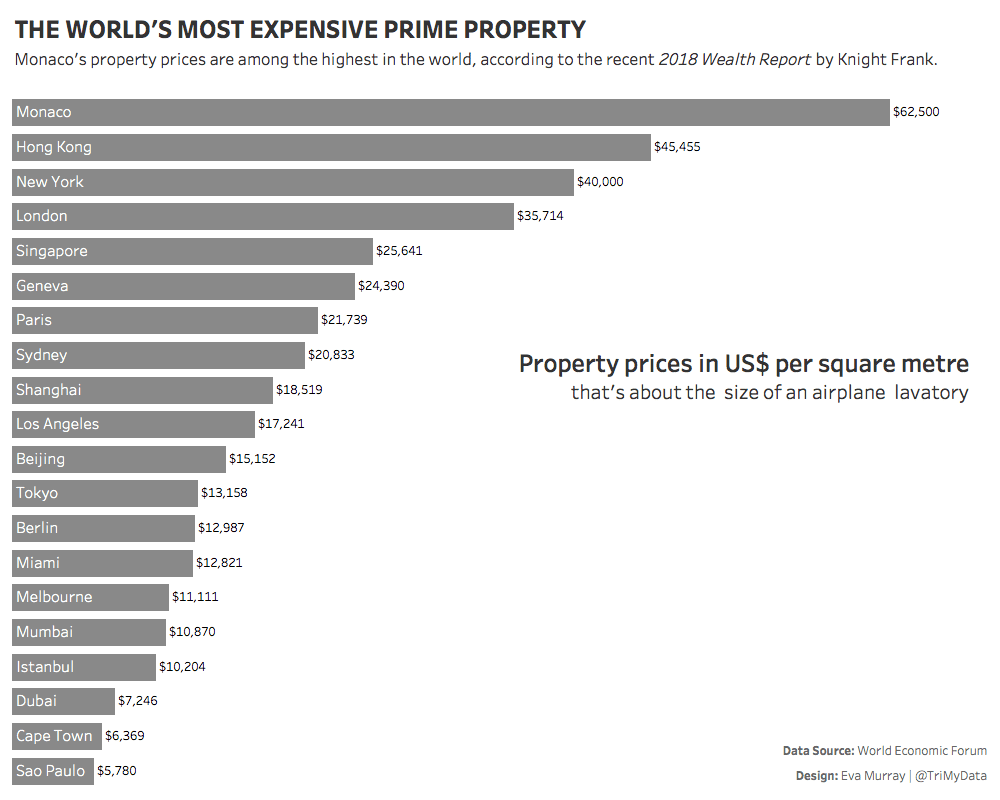
- I saw a viz by Gheorghie Lang on Twitter today and thought that yes, showing the property prices per square metre is much easier to understand than how much floor space you can buy for US$1m. Especially because most of us don’t have US$1m
- A quick calculation and a not so quick formatting session later I was done with my simple bar chart to show Monaco on top of the table. In my view Monaco should stand out much more as the most expensive place – that wasn’t really obvious in the original viz


