In this week’s dataset, the first thing I did was to sort the sports by Endurance and voila, distance cycling is on top. My faith in the world is restored and I can turn my attention to this week’s ESPN sports ranking by apparent ‘toughness’.Boxing is ranked number 1 and while I have no doubt that boxing is an incredible tough sport, I also think that ‘sports’ that are judged shouldn’t be compared with sports where there are clear and objectively identifiable winners. And while I’m on my high horse about the definition of sports, let’s please also exclude those disciplines where someone other than the human does most of the work, like horse racing,So here is the original viz: What works well:
- You can sort sports in alphabetical order, according to their total score, overall rank or by any of the individual skills
- The explanation of each skill are very helpful (even if they are placed at the very bottom of the page)
- The names of the sports are pretty straightforward
What could be improved:
- Large tables with numbers are not very useful when it comes to comparing one item to another
- The description of how these scores came about sounds like a bunch of dudes got into a room with a bowl of chicken wings and a few six packs of beers and then had a ‘discussion’. How am I supposed to take these numbers seriously?
- The sports are very hard to compare to one another because they are so different. It would be great to classify them, e.g. team sports, athletics, winter sports, etc.
What I did:
- I wanted to create a dot plot and then Andy sent me an image with an example that was literally what I had in mind, so thanks for the shortcut, Andy 🙂
- Still under time constraints due to book stuff and many hours of cycling in the lead up to my A-race for the season, I managed to create this dot plot with a little help to get the data in the right format for what I had in mind. Thanks number 2, Andy.
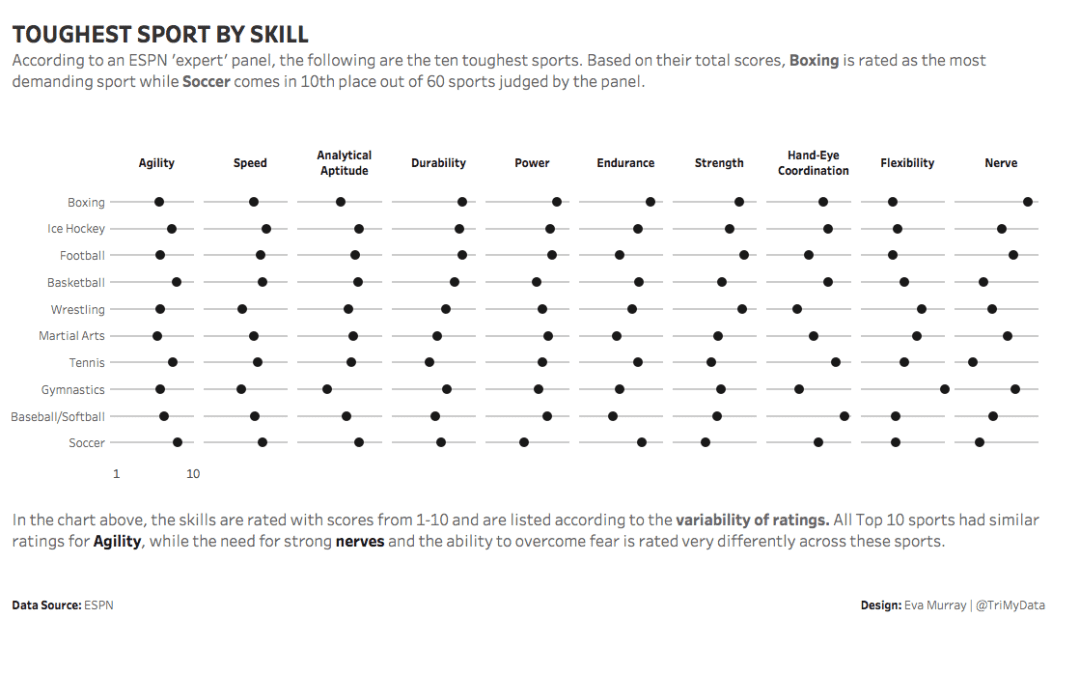
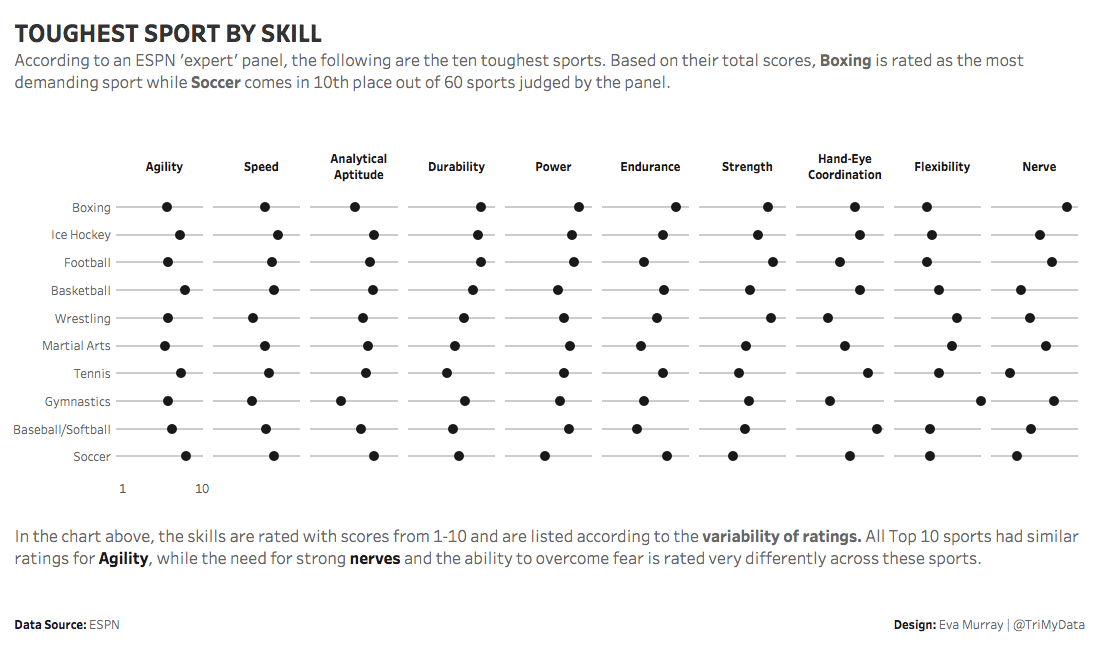
- Not wanting to take the easy way out, I did in fact include an additional calculation. Yes, sorting the skills in alphabetical order is okay, but I thought it would be more interesting to look at variability. How much variability exists between the ratings of each sport within one skill?
- And here is the final viz: Click for the interactive version


You’re welcome! Happy to help!
HI Andy. I am trying to recreate your chart in Tableau but am not able to. Can you send me a screenshot of your workbook? I’m not able to open yours after downloading. Thanks!
I’m Eva not Andy. Not sure whether you’re referring to my chart or Andy’s.You can take screenshots yourself
Apologies, I’m referring to your chart in the article. I’m a novice Tableau user and curious to find out how you configured your sheet (rows, columns, filters). Since, I am NOT able to open the workbook, I was hoping you could send me a screenshot of your sheet.