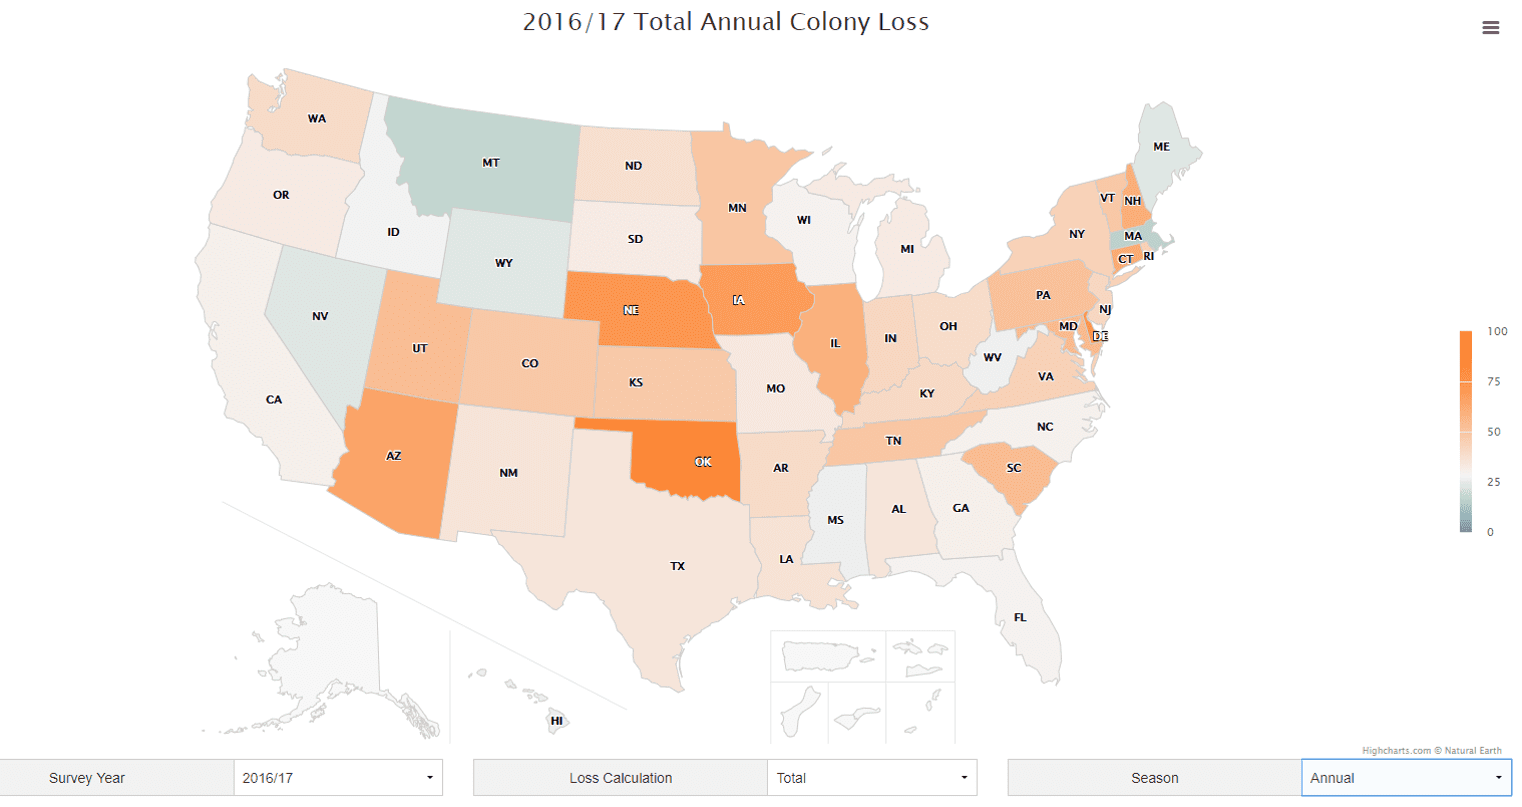
Following on from last week’s ecological footprint dataset, in week 18 we are tackling the very important and topical issue of Bee Colony Loss.There is a lot of debate about this in the media and the discussion ranges from pesticides, fertilizers, cell pone towers and the ridiculous scale of industrial agriculture to small things like the question of why these days compared to 15-20 years ago, there are hardly any dead insects stuck to the front of our cars. Have you noticed? Where are all the insects???The original visualization is the following map from ‘Bee Informed’, showing the total annual colony loss for the US in the 2016/2017 season.
What works well:
- Great interactivity and helpful filters. I particularly like that hovering over a state makes the indicator arrow on the color legend at the right side move up and down on the scale to provide an extra reference point
- Well-sized map
What could be improved:
- The color scale confuses me. The absence of color, around the 25% mark makes me think that there is no loss, but there is. The green color suggests to me that the results are positive. But are any losses positive? Are losses in that range normal and to be expected, e.g. through some natural causes?
- Why does Alaska not have a label? I appreciate that Alaska and Hawaii have been moved closer to the rest of the country to make everything easier to see, but Alaska’s size has been tampered with significantly, a note to that effect would be good. And what are the map shapes in the box above the ‘total’ loss calculation filter?
- Given that time information is available in the dataset, it would be great to see some trends and the loss figures over time
- There are notes at the bottom of the page where this viz came from, these are useful but not comprehensive. I still have so many questions
- Why are some states affected more than others?
- What actually is bee colony loss? Is it a loss of an entire colony or a certain percentage of the colony?
- And what happens when a colony is lost? Is it rebuilt?
- Do the ‘colonies’ numbers refer to the colonies before or after the loss of that year?
What I did:
- I started with some research into the topic to get a better understanding of the terms used in the data, before creating different charts to help me find out what trends and patterns are contained in the dataset.
- And then I spent all of Sunday and Monday working on the Book and am now sitting here at 9.30pm trying to finish my viz.
- A big thanks to Andy who brainstormed some ideas with me and sped up the process of pulling this viz together
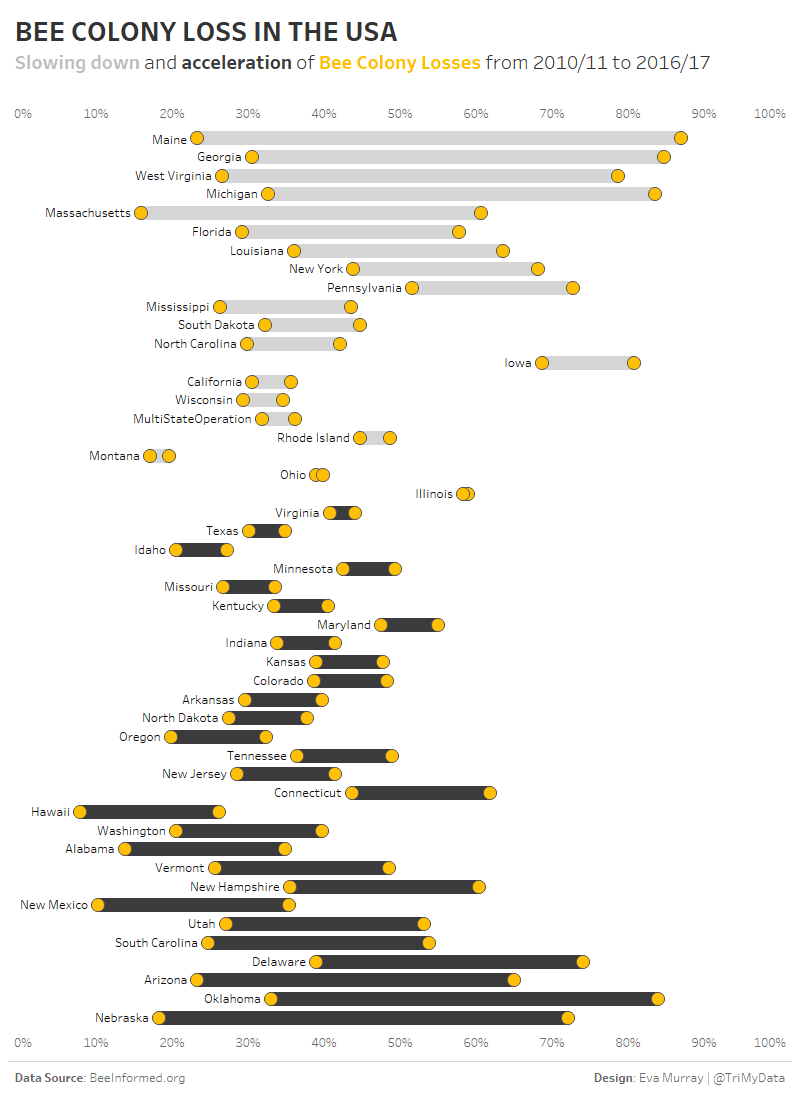
- In the end my focus is on whether or not the Total Annual Loss of Bee Colonies has slowed down or increased from 2010/11 to 2016/17


